RCWA electromagnetic field analysis software : Wsr
To Japanese
● 1. Calculation principle and wave matrix
● 2. Harmonics number rate and truncation factor New 2025/01/19
● 3. Light sources and boundary conditions for aperiodic structures.
● 4. Light source position, Top surface and any intermediate surface
● 5. Memory compression
● 6. Calculation example for a far field in the lower and upper sides
● 7. Measurement of light amount
● 8. Cross-sections for various structures
● 9. Calculation example for lens focusing
● 10. Calculation of diffraction efficiency
● 11. Visualizing the calculation results
● 12. Output files
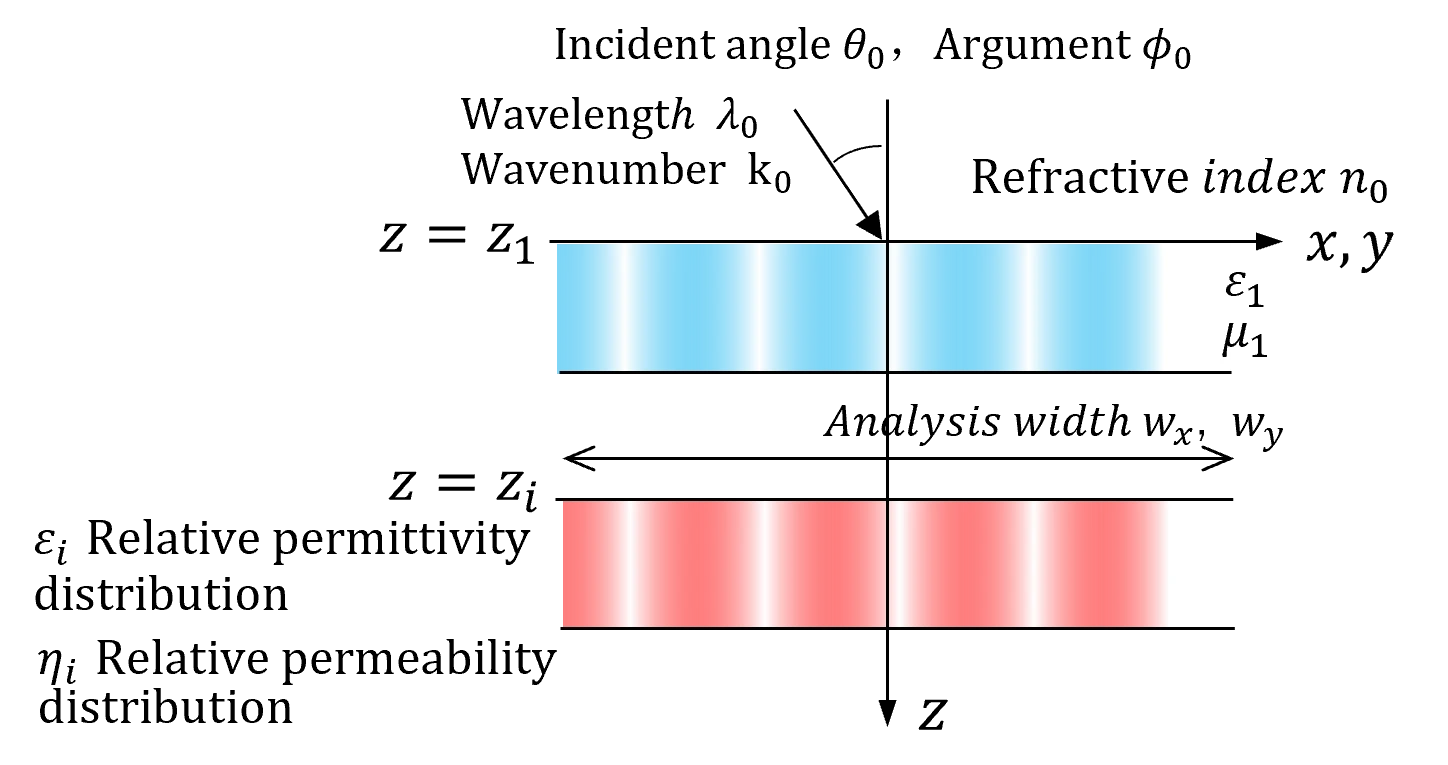
(1) Definition of electromagnetic vectors and lattice matrix.
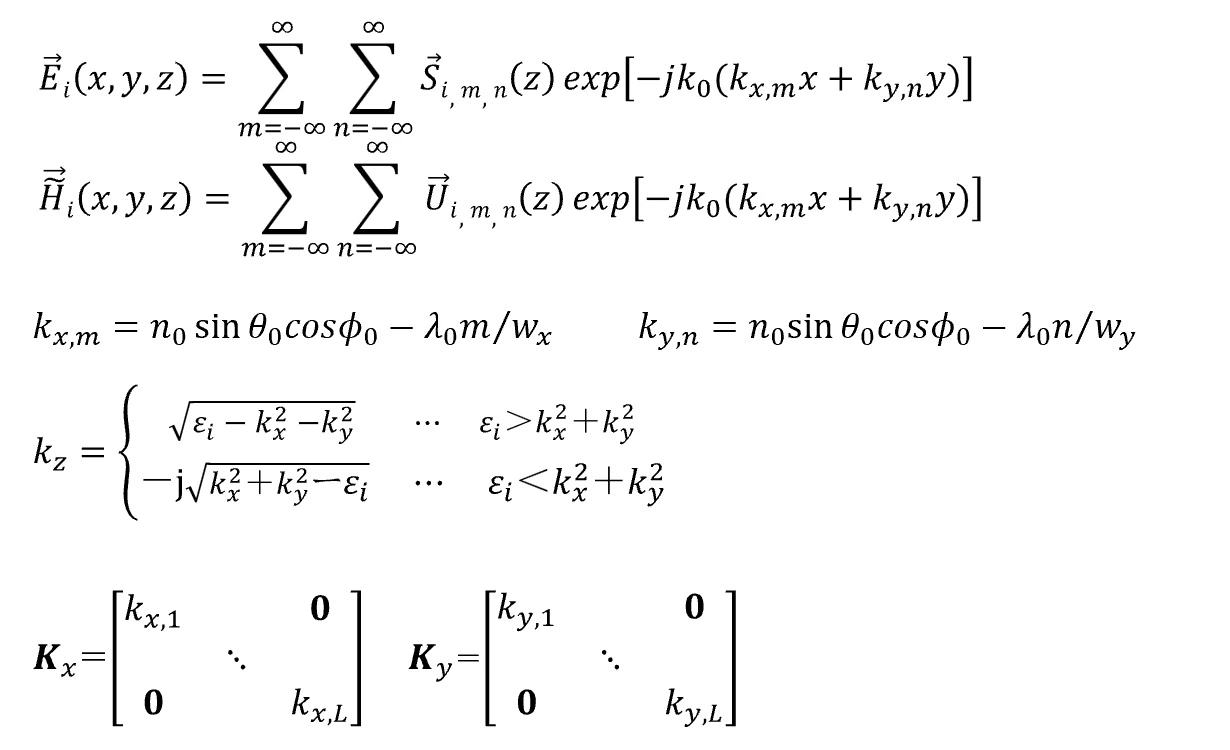
(2) Convolution matrix calculation of relative permittivity and compression of the matrix.
A square matrix of (2n+1)×(2n+1) is extracted from the center of the discrete Fourier transform matrices for the permittivity distribution εi(x,y) and a convolution matrix of size (n+1))2×(n+1)2)2 is generated. The extraction shape can be reduced to a circle or diamond, and the size of the convolution matrix can be also greatly compressed. This is a unique feature of wsr. In wsr, n (harmonics number) is set by hm (harmonics number rate) and the extraction shape is set by trc (truncation factor). This extraction is an approximate operation in the RCWA method and should be determined in consideration of the balance with the computational load since it sacrifices computational accuracy. If the extracted shape is square, the size of the matrices 𝑷𝑖i, 𝑸i , 𝜴𝑖i2, and 𝑾i becomes 2(n+1)2×2(n+1)2 and the matrix size of the wave equation becomes 4(n+1)2×4(n+1)2. The computational load of memory and CPU is proportional to (2n)2.
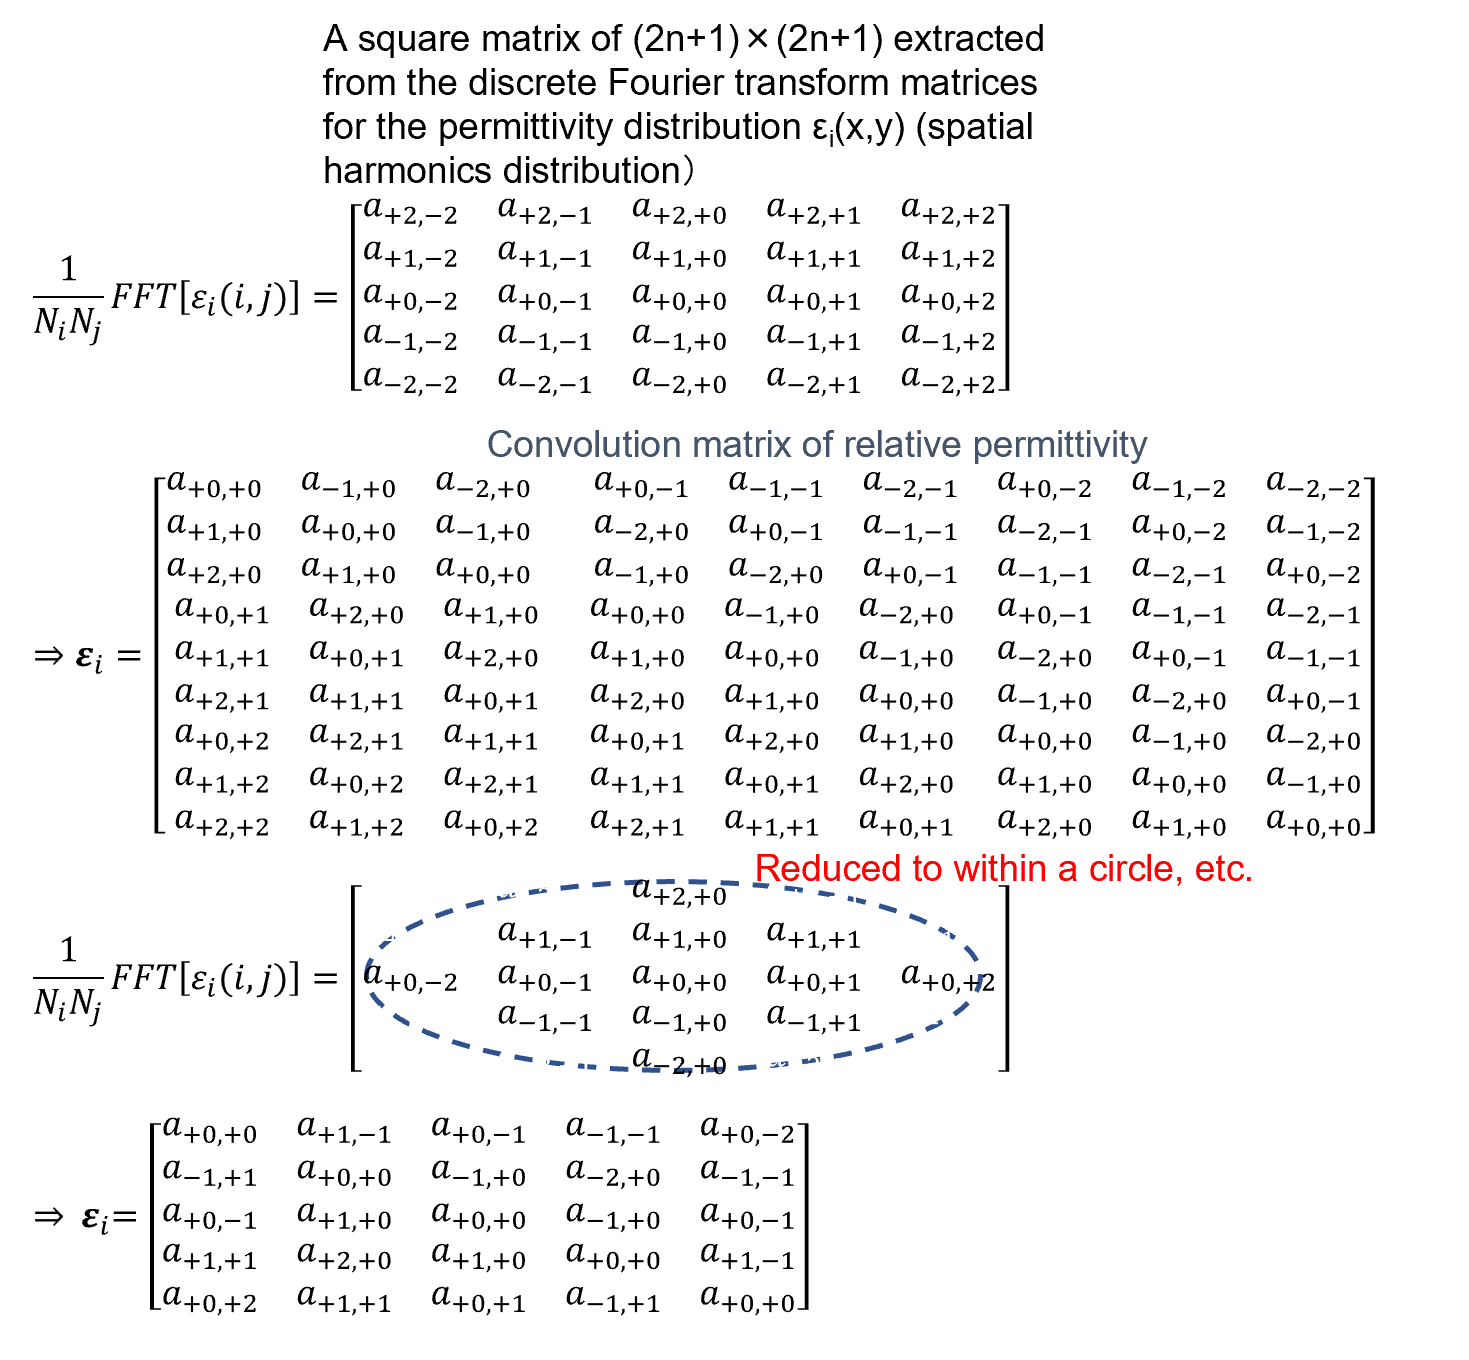
(3) Structural matrix calculation.
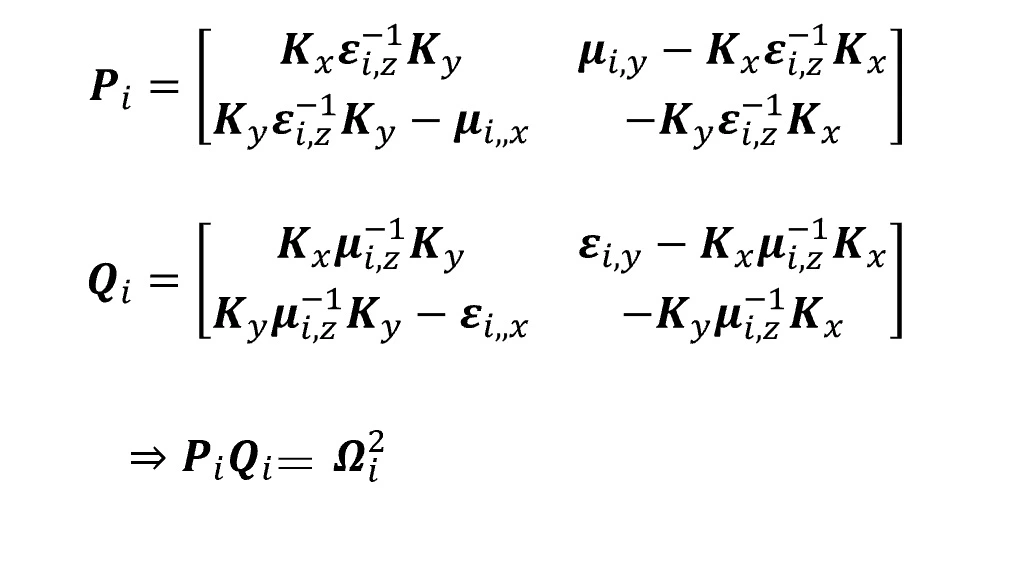
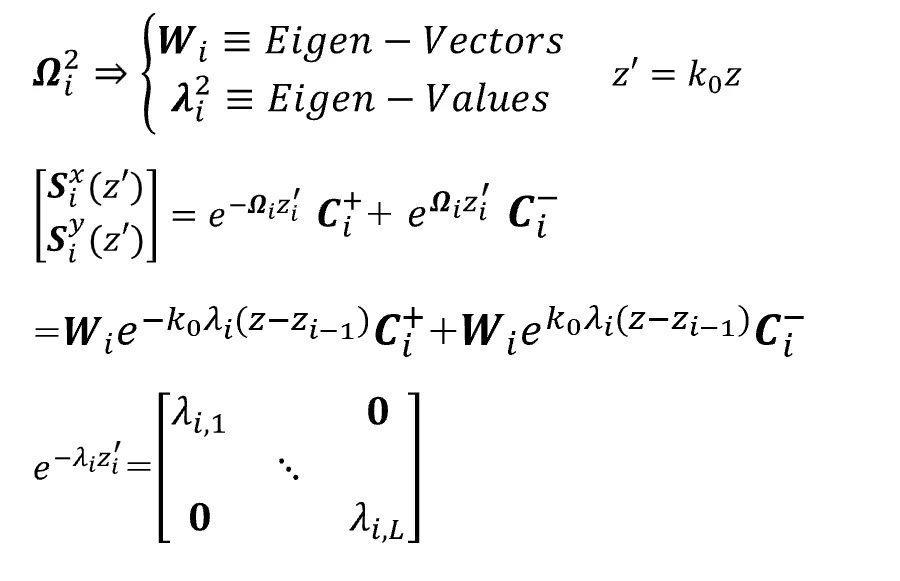
(4) Solution of eigenvalue problems.
(5) Alignment of matrices.
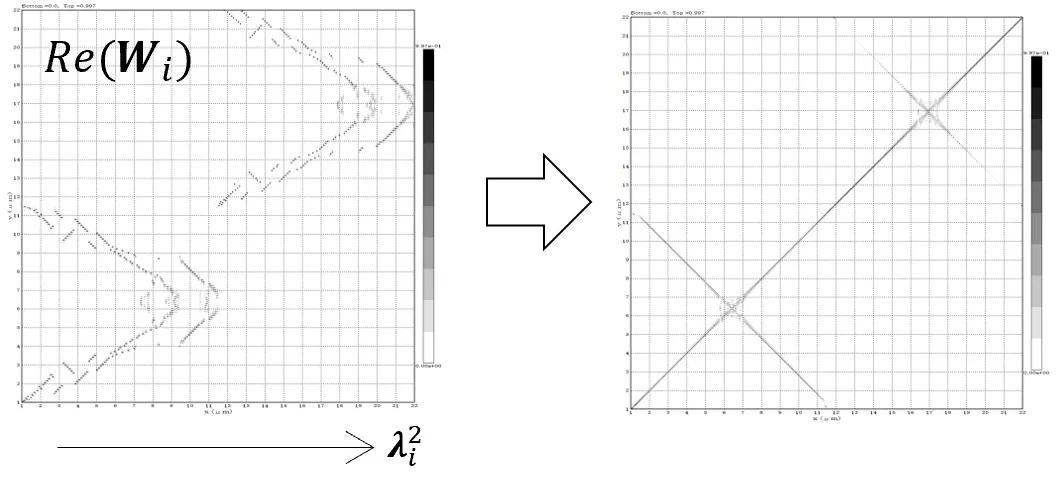
The matrix is aligned by switching the order of eigenvalues λi2 to align the diffraction orders.
(6) Solving the wave equation.
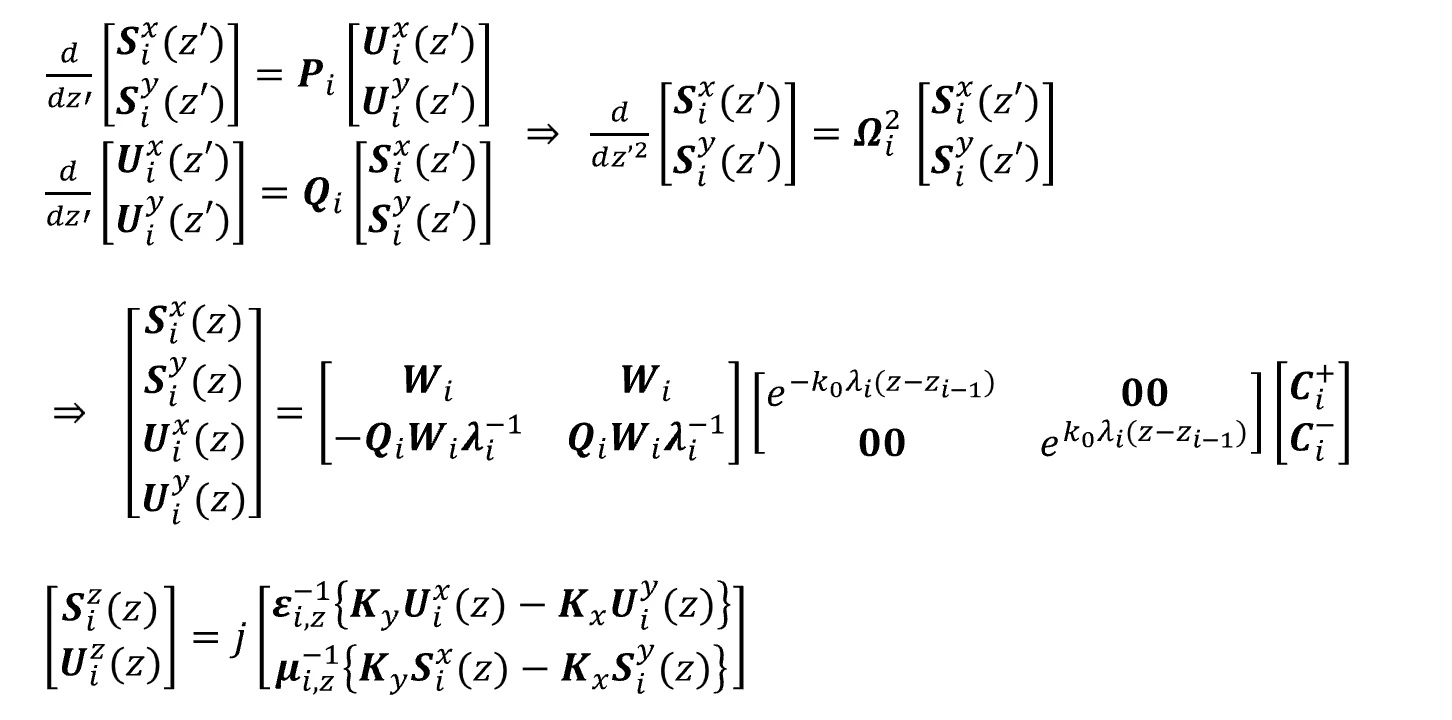
If the harmonics number (integer) is n, the wavelength is λ and the width of the analysis domain is w, the harmonics number rate hm is defined by hm=nw/λ. The size of the Convolution matrix is limited by hm and trc (truncation factor) by the following formula; |i/n|2*trc+|j/n|2*trc<1.0.
The larger hm and the smaller trc, the greater the calculation accuracy but also the greater the memory consumption (hm limited to 5 or less before purchase).
(2) hm and solution stability for transmissivity
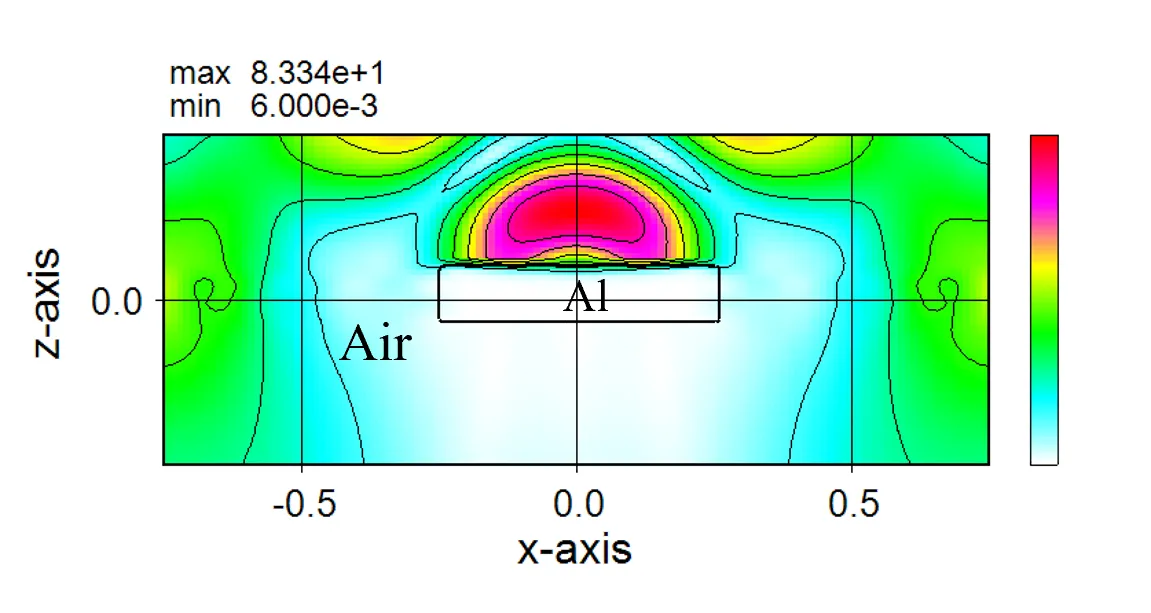
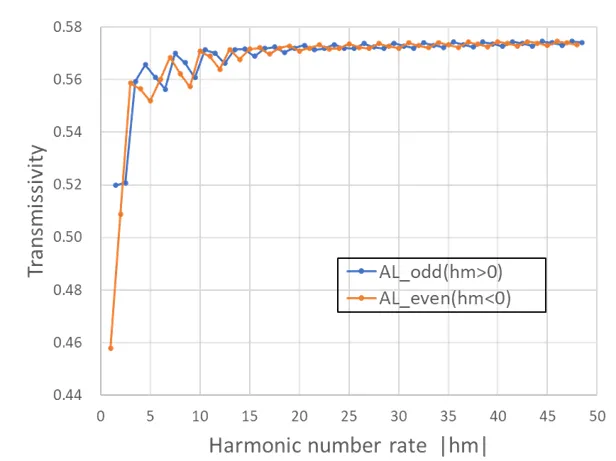
The figure below shows the stability of the solution (transmissivity) with respect to hm in the metal disc model with trc fixed (trc=1.0). hm is stable above 5, but there is a difference in behaviour depending on whether the harmonics number n is even or odd, with even numbers being more stable, so Wsr chooses even numbers unless specified otherwise.
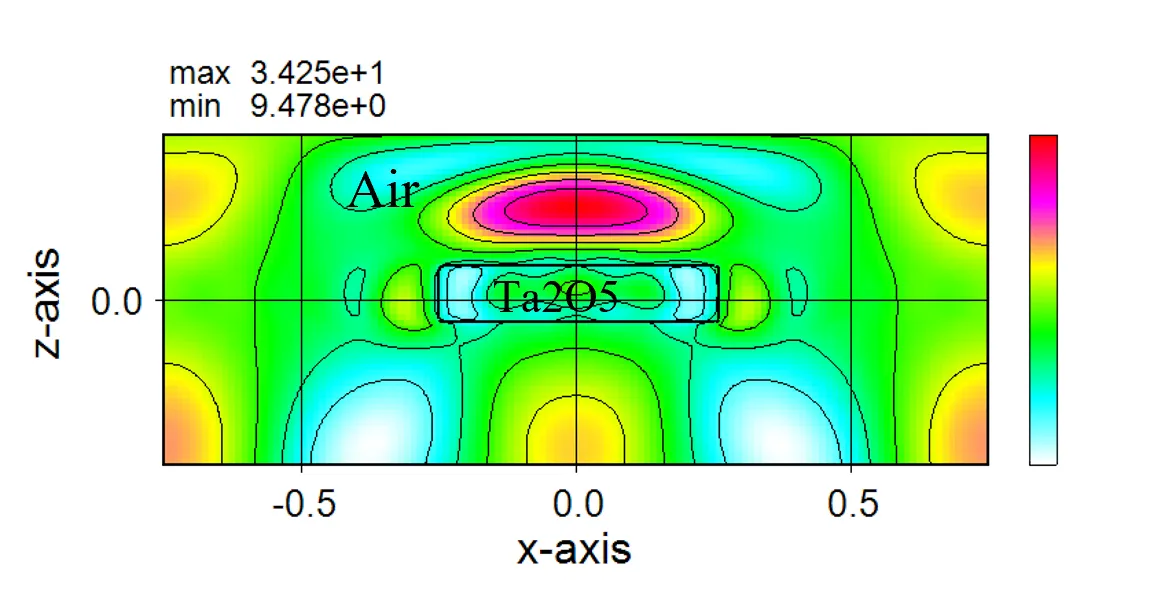
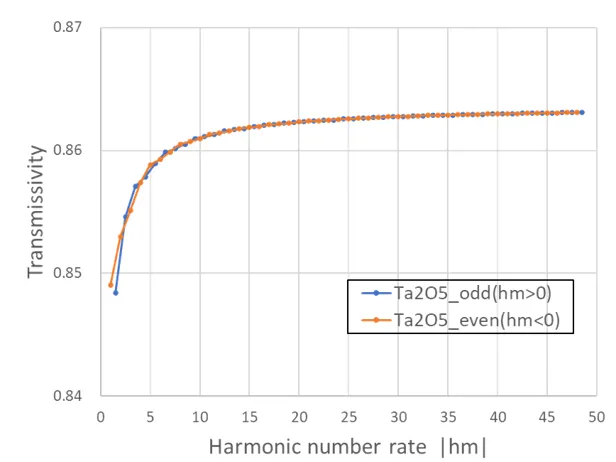
The figure below shows the solution stability for transmissivity with respect to hm in the dielectric disc model with fixed trc (trc=1.0). hm is stable above 5, but the difference between even and odd numbers is small.
(3) trc and solution stability for transmissivity
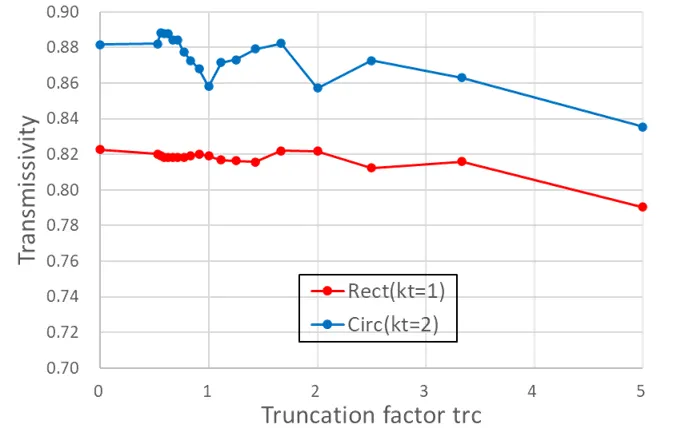
The diagram below shows the stability of the solution (transmissivity) with respect to trc in a metal model comparing a circle plate and a square plate with hm fixed (hm=5.0). The solution is stable for trc less than 3 for the circle and 4 for the square.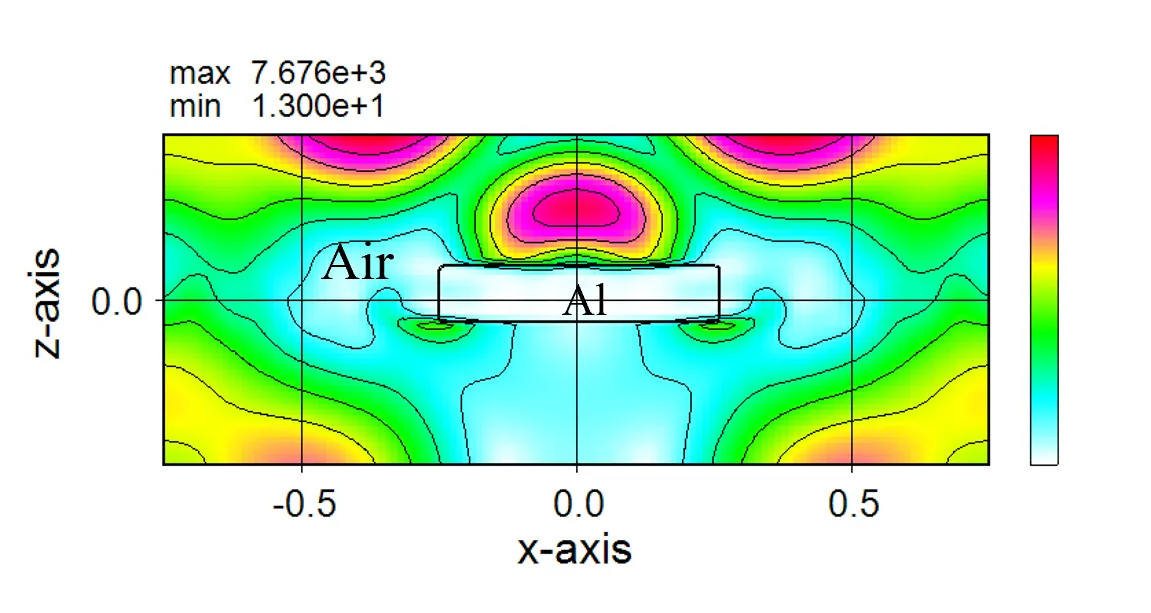
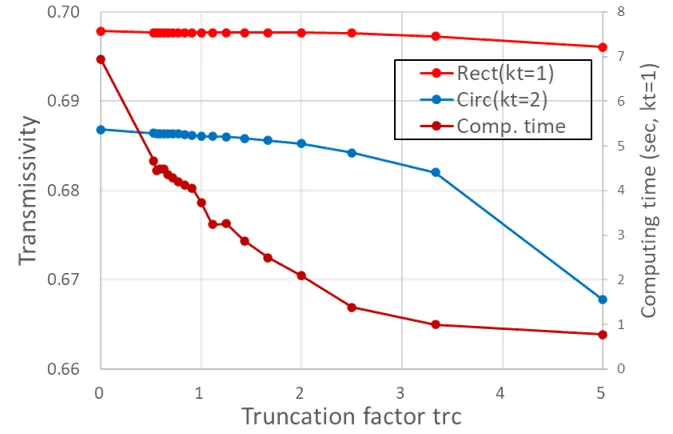
The diagram below shows the stability of the solution (transmissivity) with respect to trc in a dielectric model comparing acircular plate and a square plate with hm fixed (hm=5.0). The solution is stable for trc less than 3 for the circle and 4 for the square.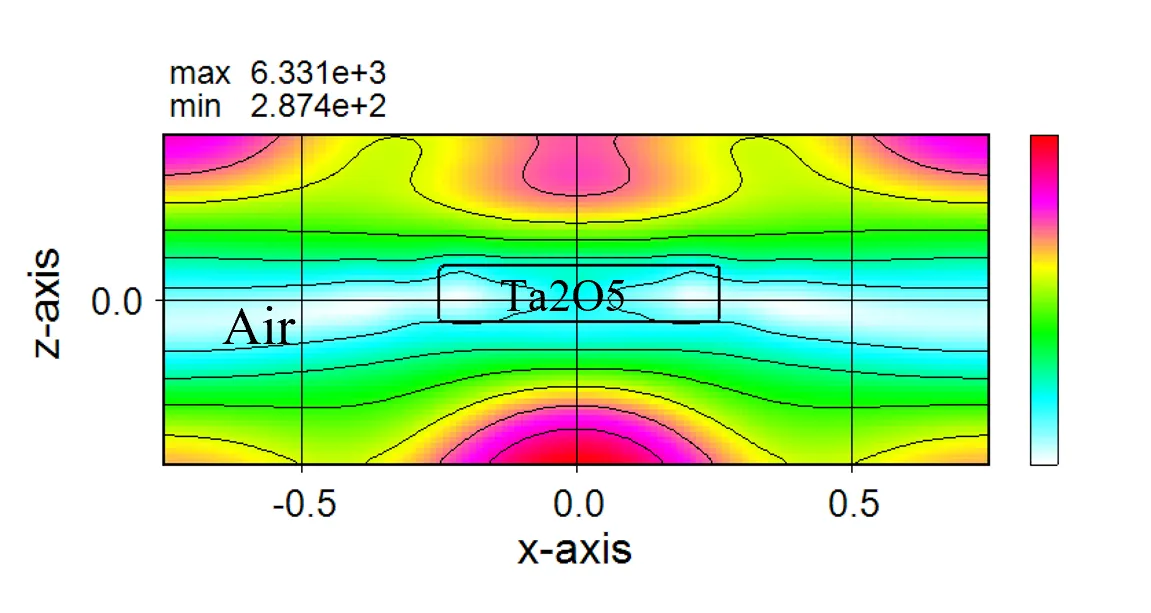
(4) trc and distributions of spatial harmonics
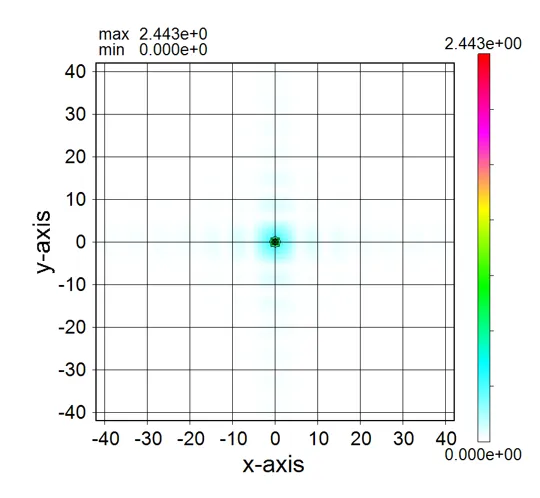
The Spatial harmonics distribution (eps.out) for a circular structure is isotropically spread.
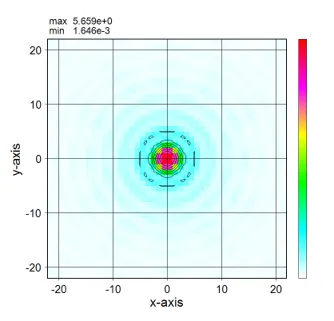
In contrast, the distribution for square structures extends along the 0° and 90° directions.
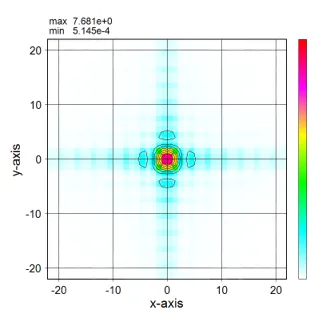
Therefore, setting trc=1.0 for circular structures and trc=2.0 for square structures causes little degradation in calculation accuracy and compresses memory consumption by a factor of 0.6 and 0.25 respectively.
(5) hm and trc
The setting of hm,trc is one of the approximation operations in the RCWA method, as it restricts the defined area of the Convolution matrix, but it enables significant memory compression and calculation speed-up. The approximation error can also be minimised by appropriate settings of hm and trc. The region restriction by trc is a unique feature of Wsr and can achieve several times higher calculation performance than commercial software.
● In the case of a distributed light source and a periodic boundary condition (PBC).
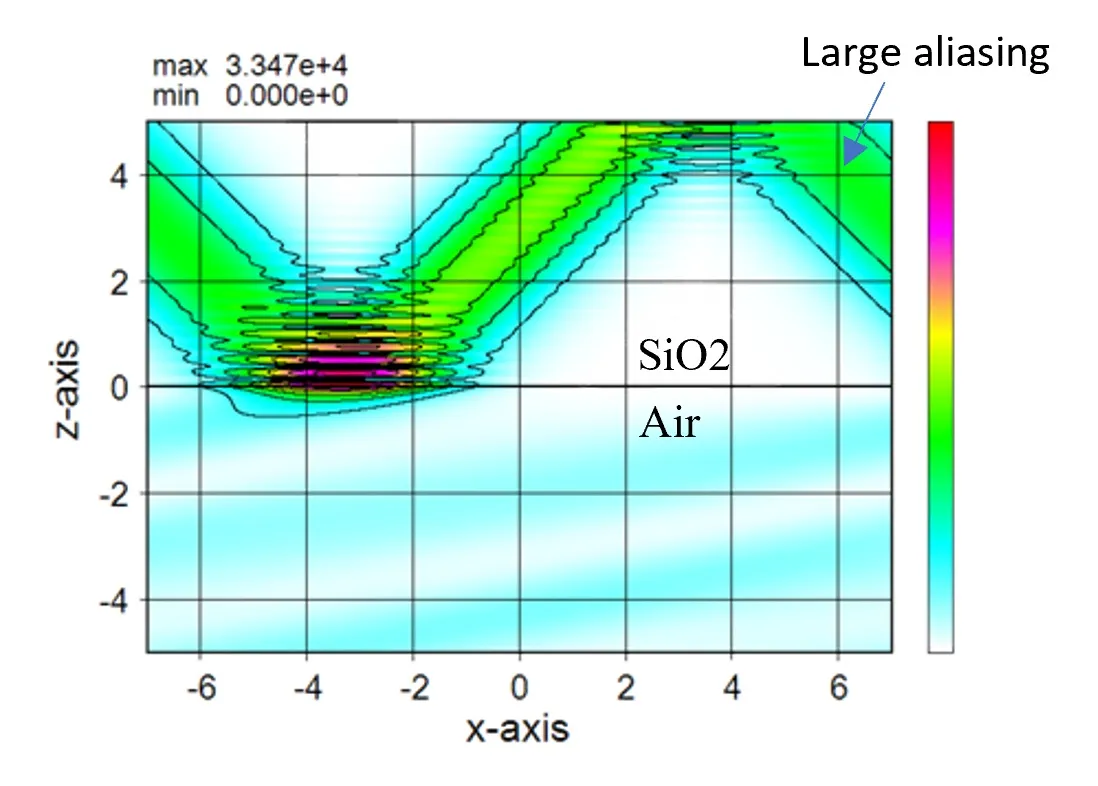
● In the case of a distributed light source and an absorbing boundary condition (ABC).
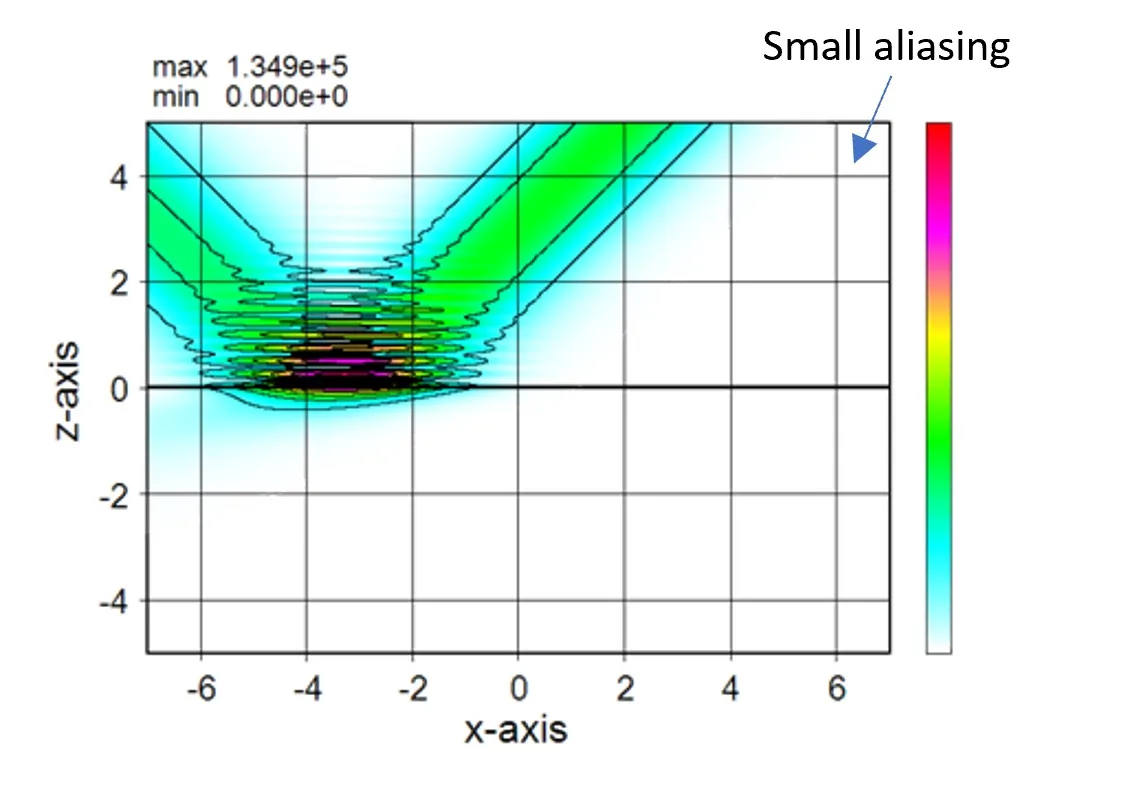
● When the light source position is on the top surface.
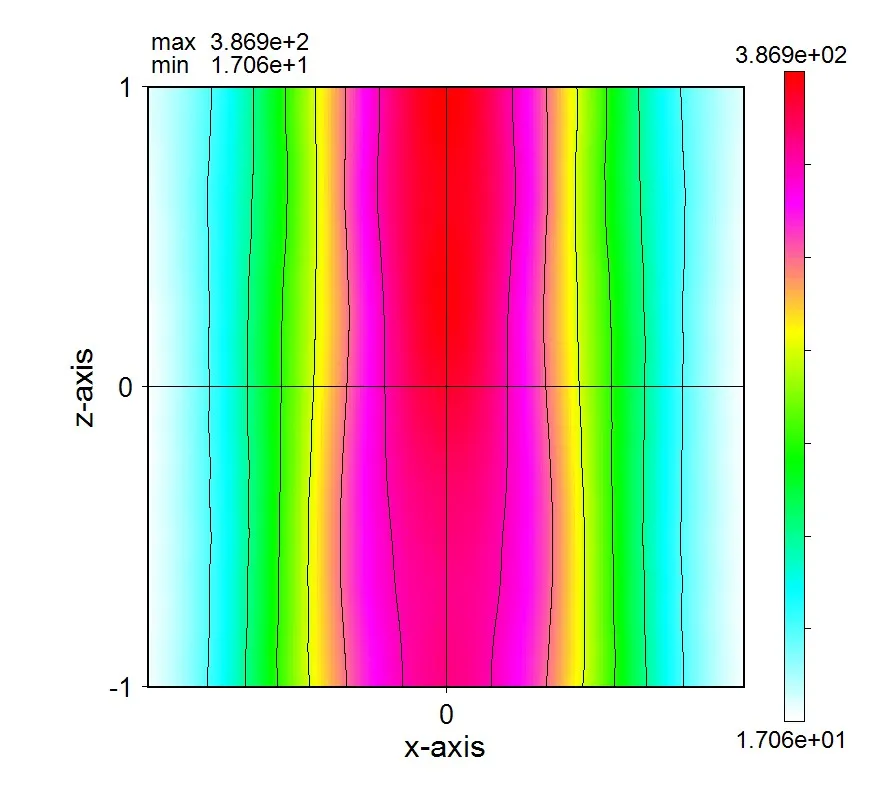
● When the light source position is in the middle plane.
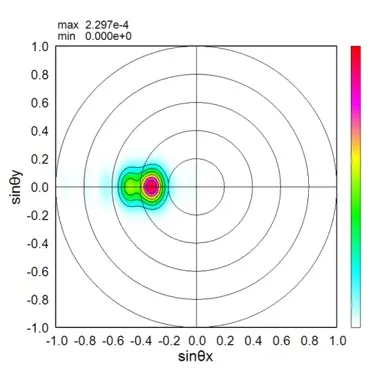
● Far field pattern in the lower side.
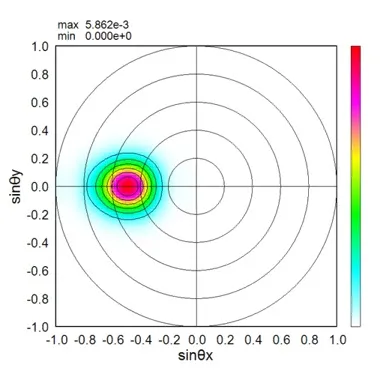
● Far field pattern in the upper side.
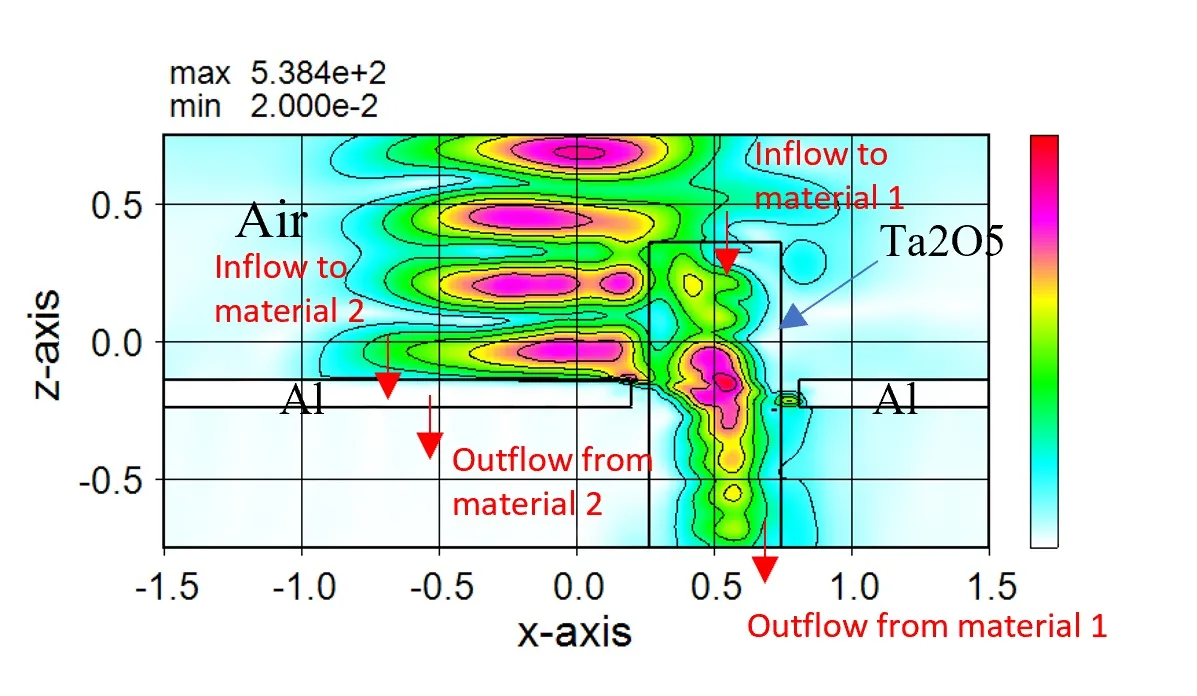
● Measurement result for each material region.

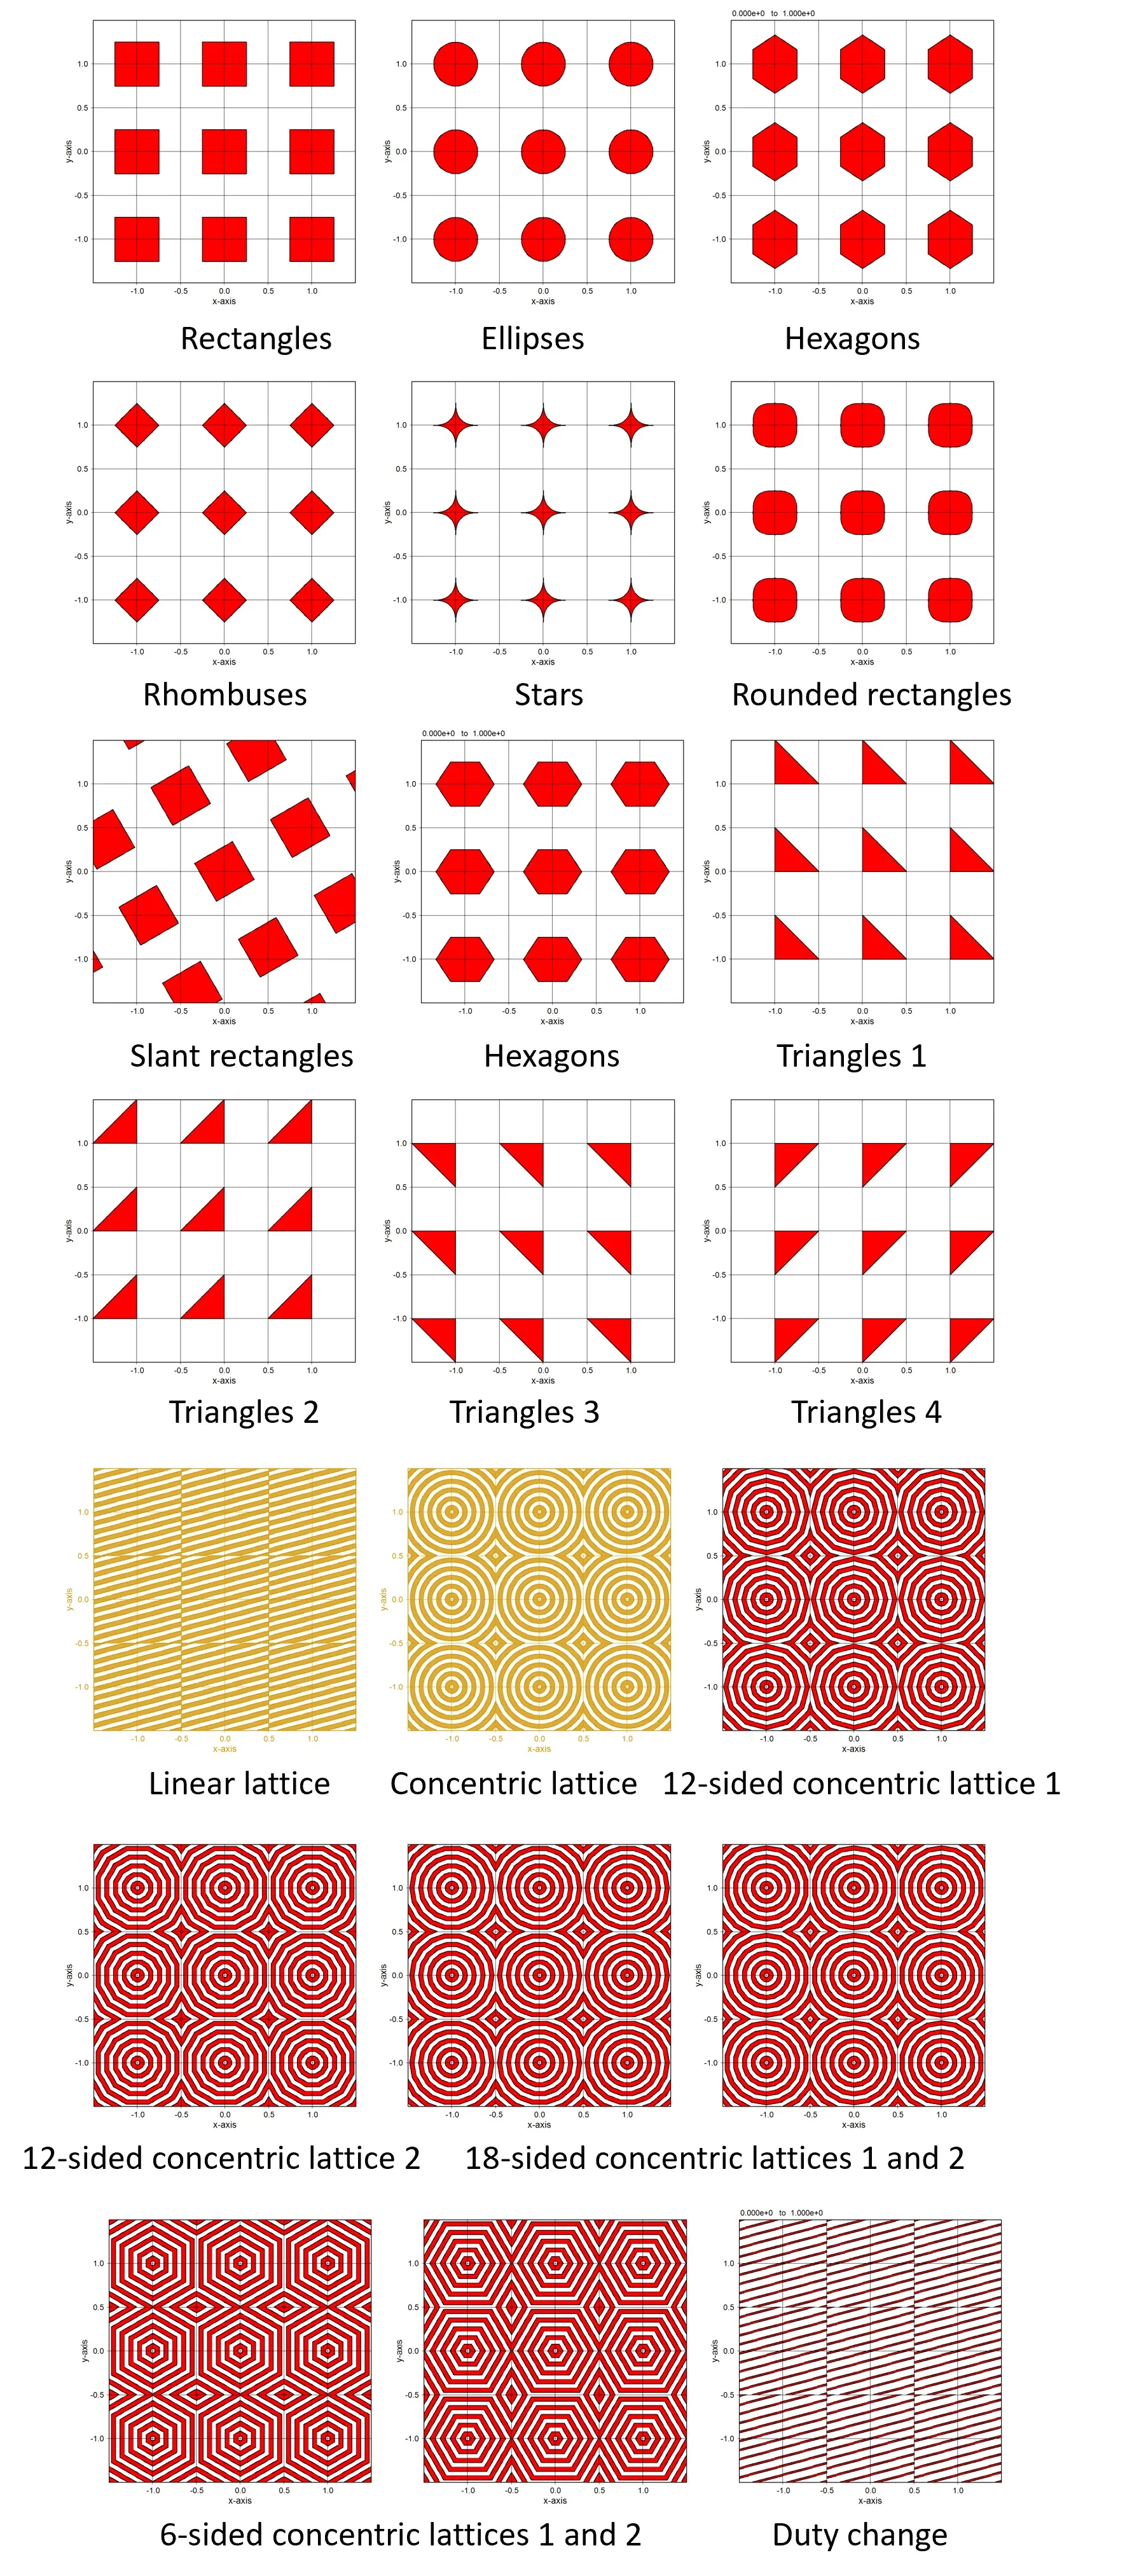
● In the case of external definition using sub.dat.
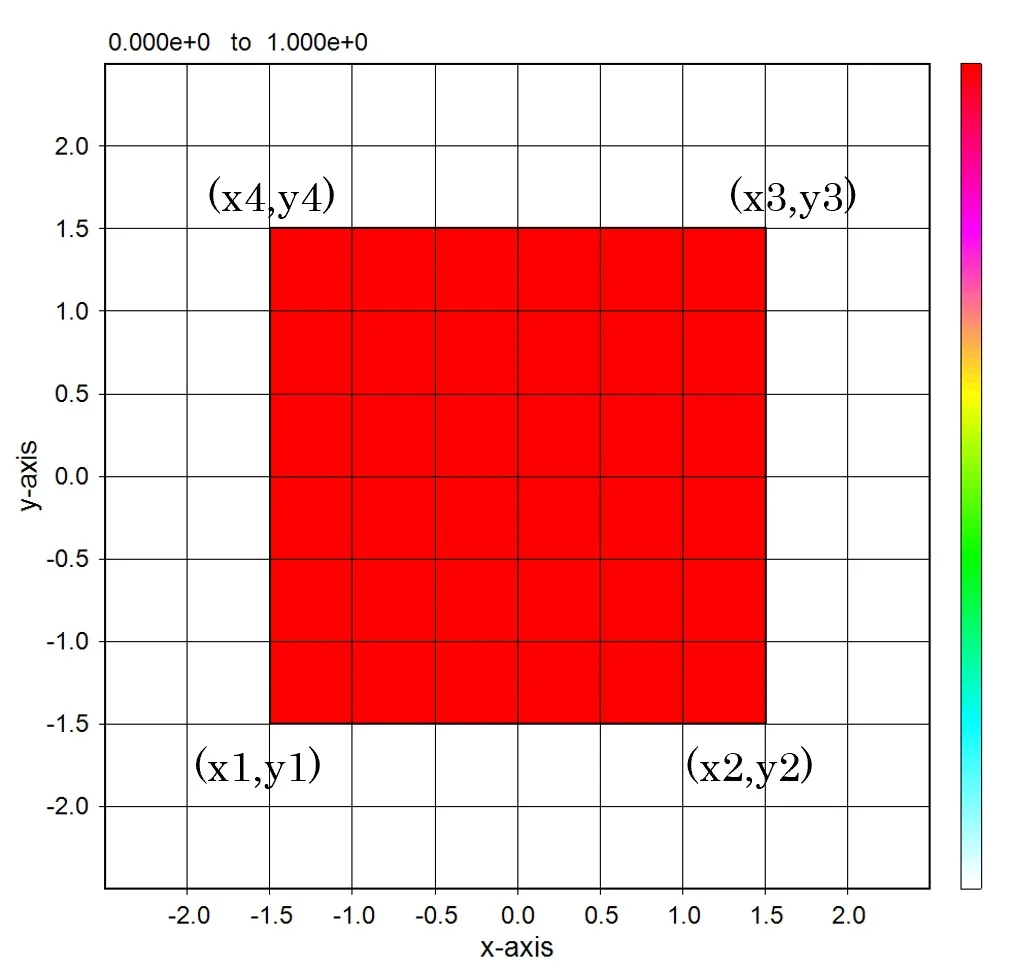
The isolated structure can be defined by the four points (x1,y1), (x2,y2), (x3,y3), and (x4,y4) described in sub.dat.
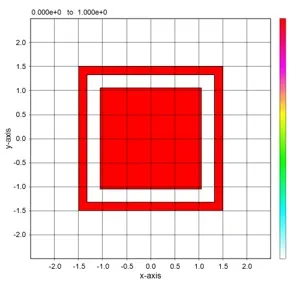
The structure defined by the piled data of four points. A periodic pattern for these structures can be defined easily.
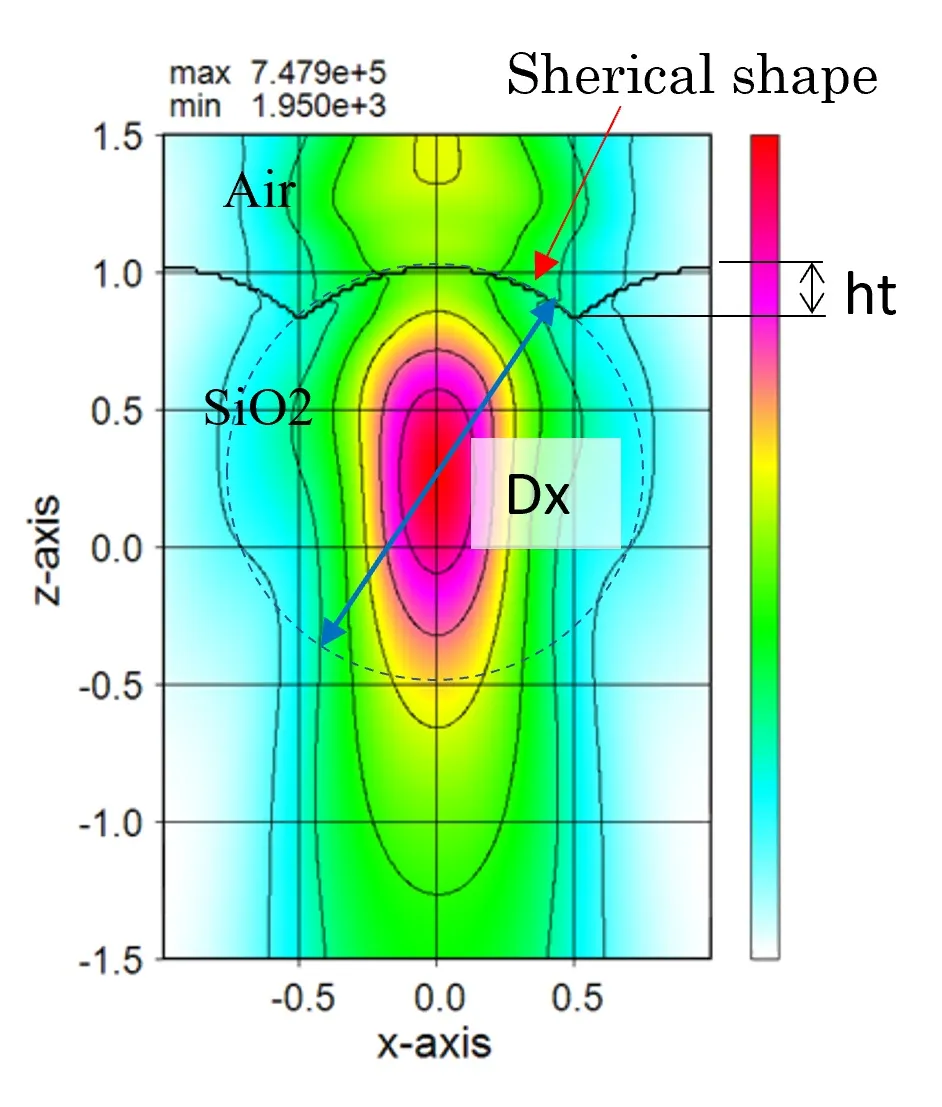
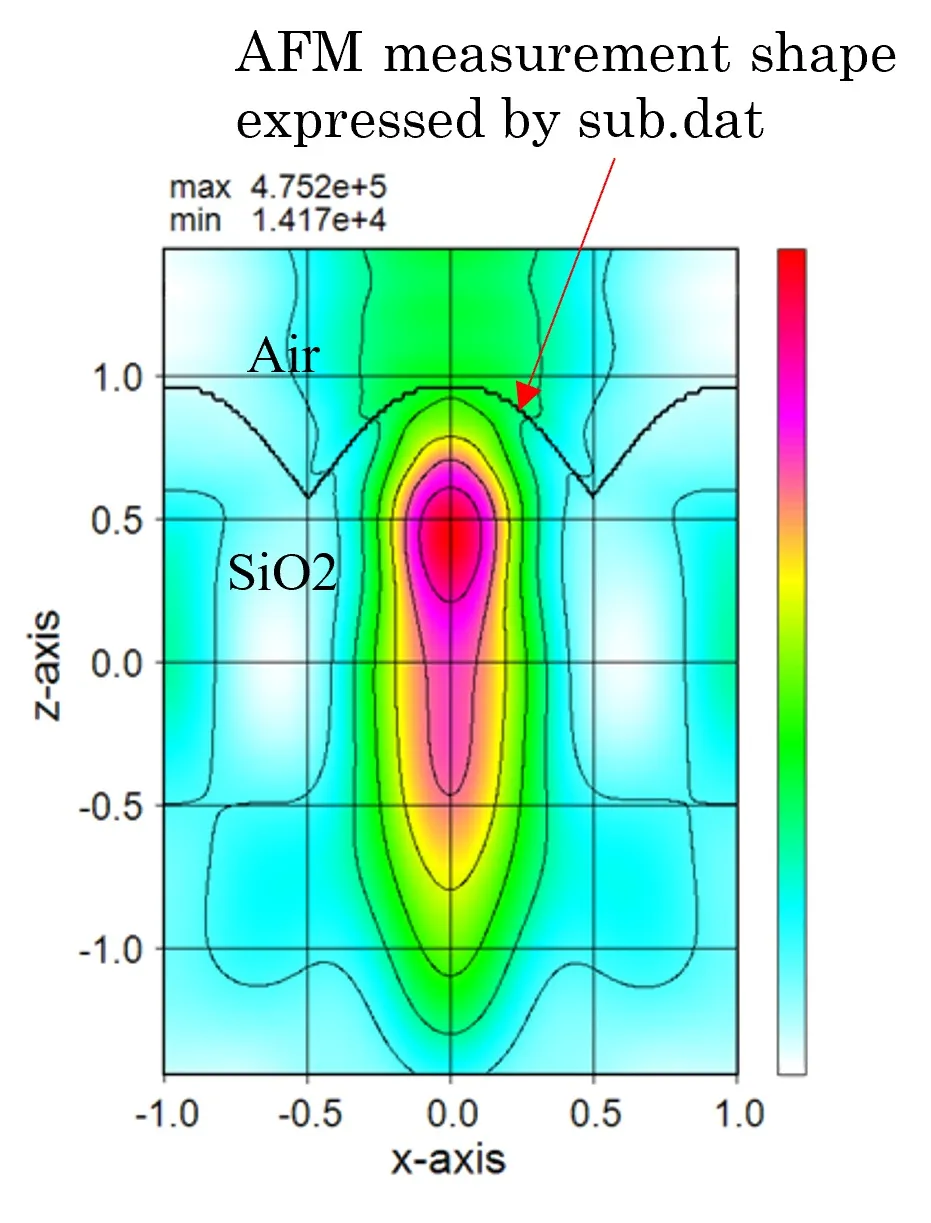
● The lens shape is expressed by stacking the externally defined circular structure.
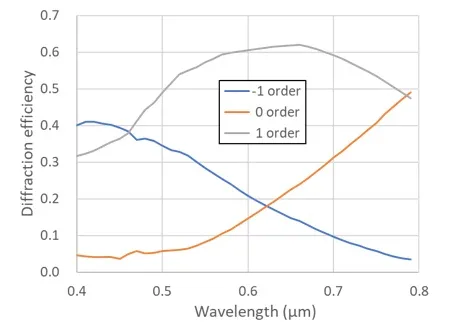
● Wavelength dependence of diffraction efficiency on the model shown above.
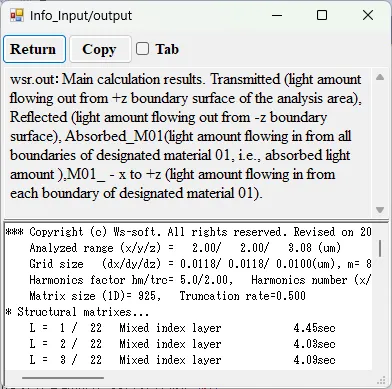
● wsr.out Main calculation results.
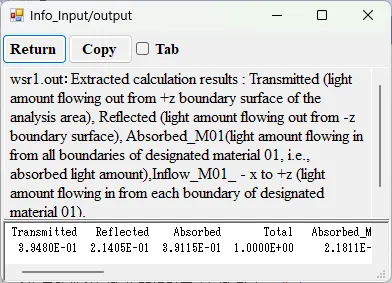
● wsr1.out Extracted calculation results.
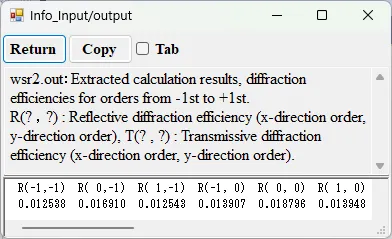
● wsr2.out Diffraction efficiencies for diffraction orders from -1st to +1st.
● i_xy.out xy cross-sectional distributions of light intensity.
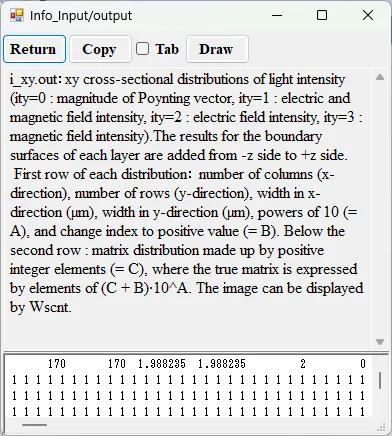
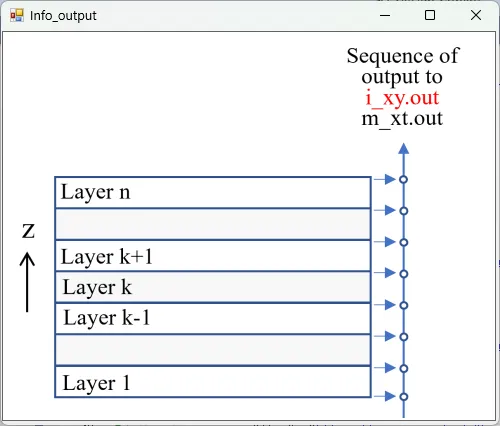
drawing example.
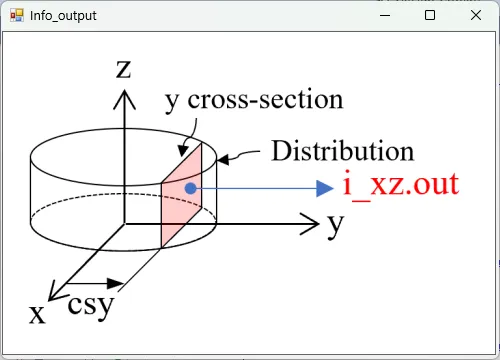
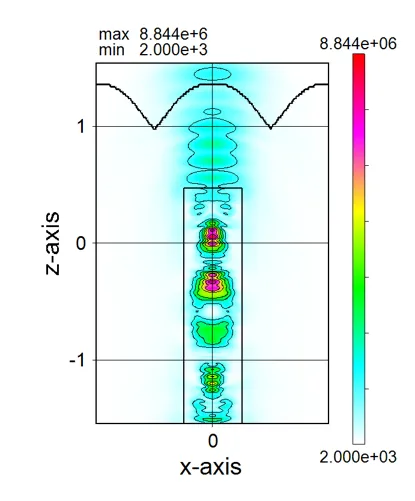
● i_xz.out xz cross-sectional (y=csy) distributions of light intensity.
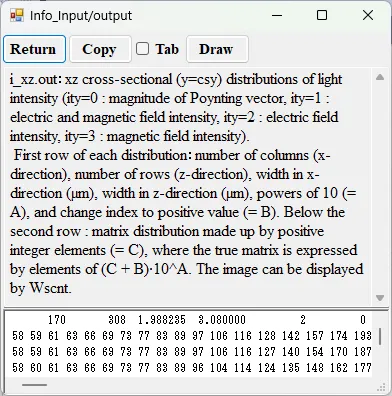
drawing example.
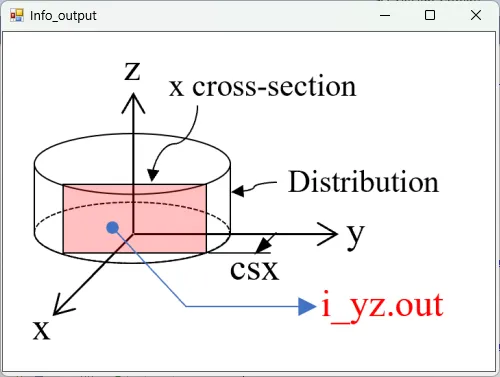
● i_yz.out yz cross-sectional (x=csx) distributions of light intensity.
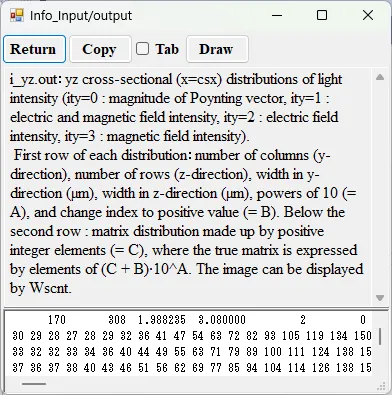
drawing example.
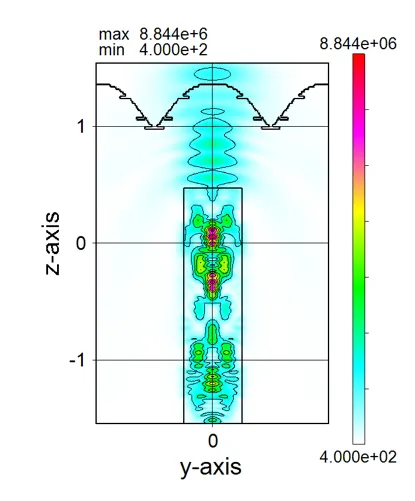
● i_z045.out Cross-sectional distribution with 45-degrees rotation around z-axis for light intensity.
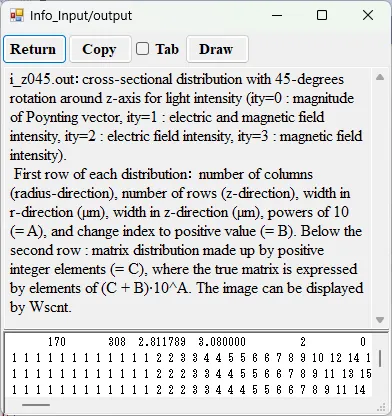
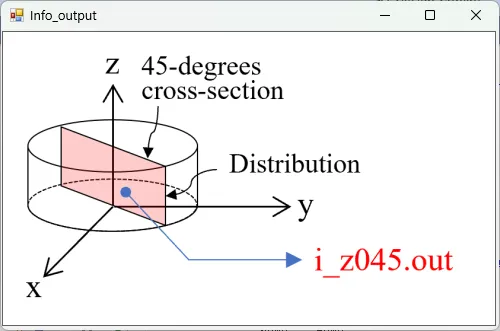
drawing example.
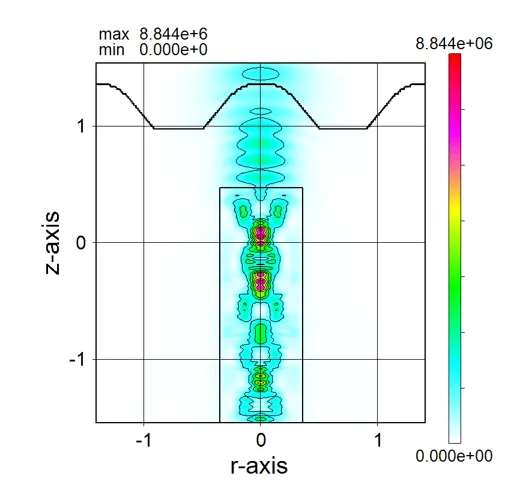
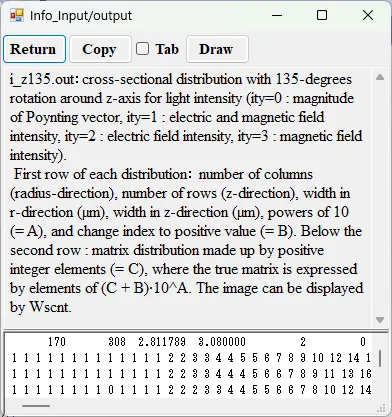
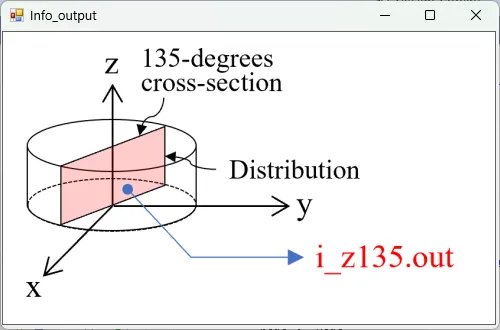
● i_z135.out Cross-sectional distribution with 135-degrees rotation around z-axis for light intensity.
drawing example.
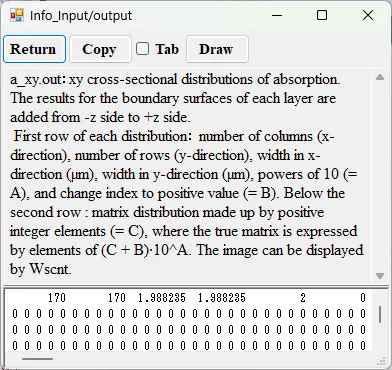
● a_xy.out xy cross-sectional distributions of absorption.
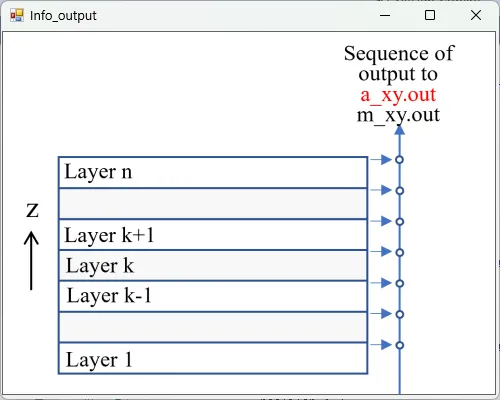
drawing example.
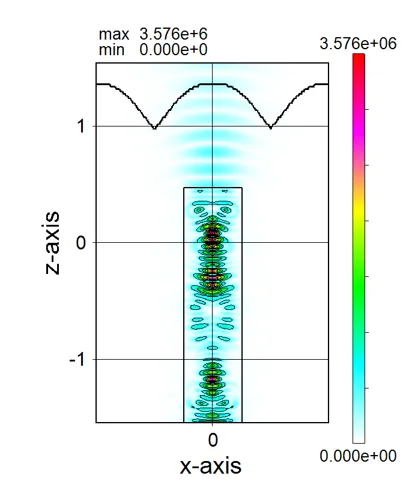
● a_xz.out xz cross-sectional (y=csy) distributions of absorption.
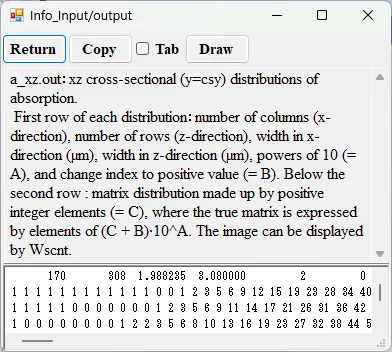
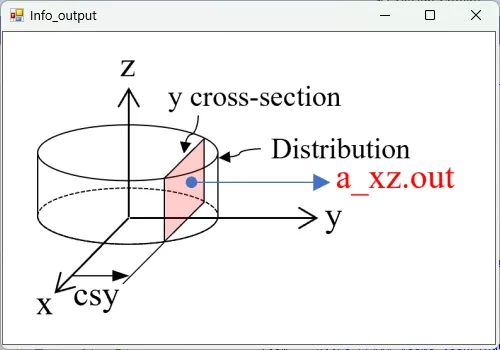
drawing example.
● a_yz.out yz cross-sectional (x=csx) distributions of absorption.
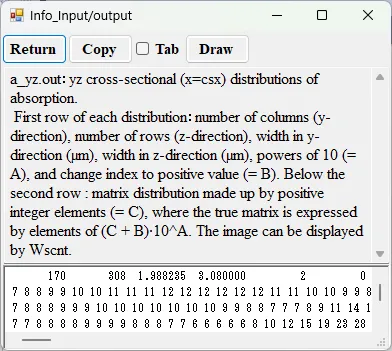
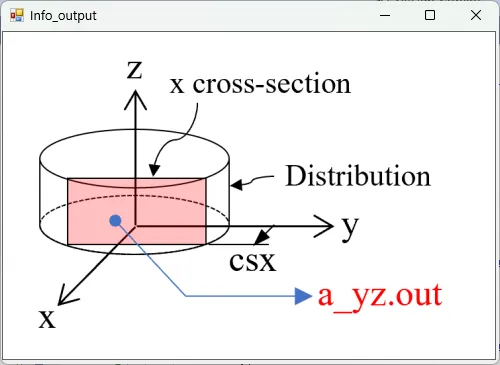
drawing example.
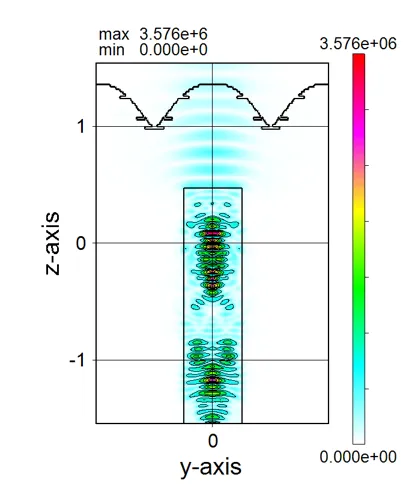
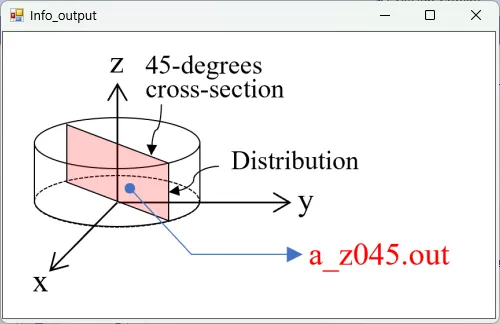
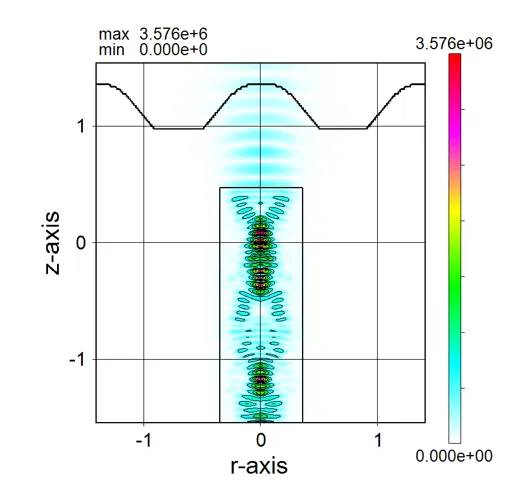
● a_z045.out Cross-sectional distribution with 45-degrees rotation around z-axis for absorption.
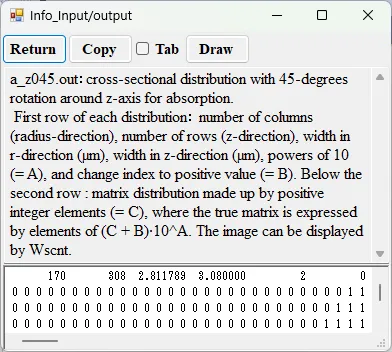
drawing example.
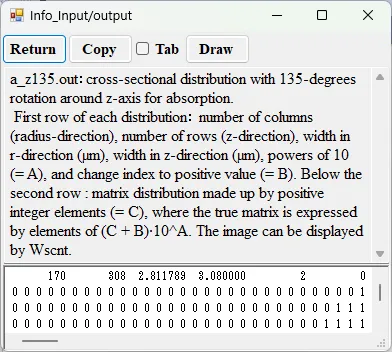
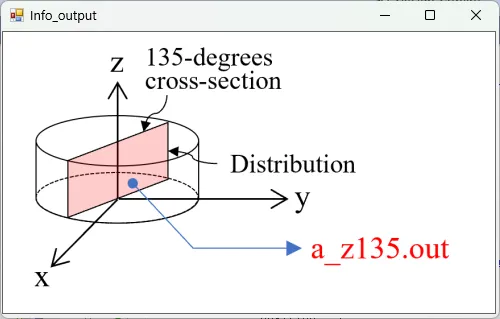
● a_z135.out Cross-sectional distribution with 135-degrees rotation around z-axis for absorption.
drawing example.
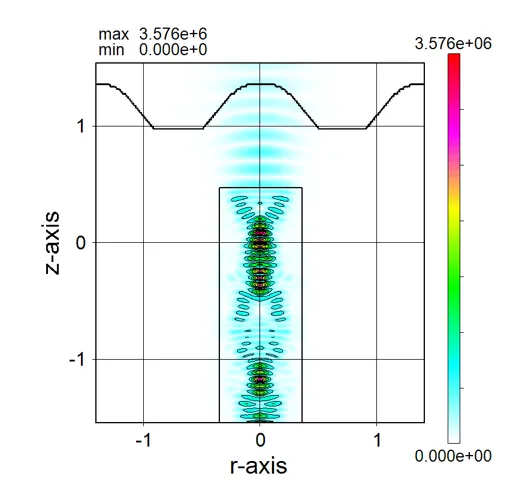
● i_far.out Far-field intensity distributions.
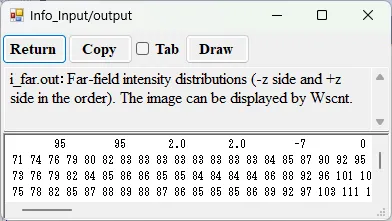
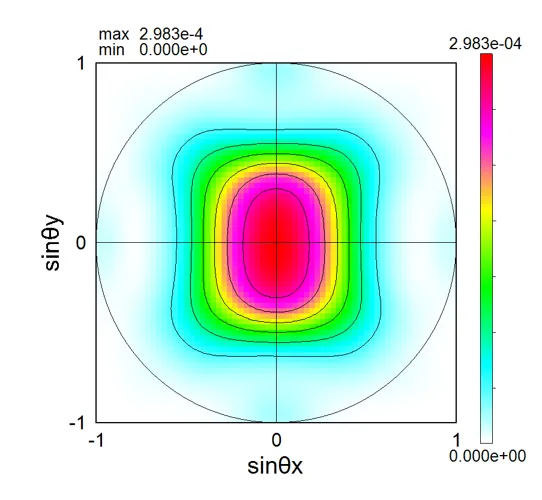
drawing example.
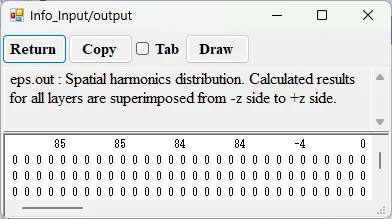
● eps.out Spatial harmonics distribution.
drawing example.
● 2. Harmonics number rate and truncation factor New 2025/01/19
● 3. Light sources and boundary conditions for aperiodic structures.
● 4. Light source position, Top surface and any intermediate surface
● 5. Memory compression
● 6. Calculation example for a far field in the lower and upper sides
● 7. Measurement of light amount
● 8. Cross-sections for various structures
● 9. Calculation example for lens focusing
● 10. Calculation of diffraction efficiency
● 11. Visualizing the calculation results
● 12. Output files
1. Calculation principle and wave matrix ▲top
The calculation principle of wsr is RCWA (rigorous coupled-wave analysis), which solves the Maxwell equation (Wave Matrix) in Fourier space through the processes (1)-(6) below. If the structure consists of m layers ( i=1~m), the processes (1)-(6) are carried out in each layer.
(1) Definition of electromagnetic vectors and lattice matrix.

(2) Convolution matrix calculation of relative permittivity and compression of the matrix.
A square matrix of (2n+1)×(2n+1) is extracted from the center of the discrete Fourier transform matrices for the permittivity distribution εi(x,y) and a convolution matrix of size (n+1))2×(n+1)2)2 is generated. The extraction shape can be reduced to a circle or diamond, and the size of the convolution matrix can be also greatly compressed. This is a unique feature of wsr. In wsr, n (harmonics number) is set by hm (harmonics number rate) and the extraction shape is set by trc (truncation factor). This extraction is an approximate operation in the RCWA method and should be determined in consideration of the balance with the computational load since it sacrifices computational accuracy. If the extracted shape is square, the size of the matrices 𝑷𝑖i, 𝑸i , 𝜴𝑖i2, and 𝑾i becomes 2(n+1)2×2(n+1)2 and the matrix size of the wave equation becomes 4(n+1)2×4(n+1)2. The computational load of memory and CPU is proportional to (2n)2.

(3) Structural matrix calculation.

(4) Solution of eigenvalue problems.

(5) Alignment of matrices.
The matrix is aligned by switching the order of eigenvalues λi2 to align the diffraction orders.

(6) Solving the wave equation.

2. hm (Harmonics number rate) and trc (Truncation factor) ▲top
(1) Relationship with the size of the Convolution matrixIf the harmonics number (integer) is n, the wavelength is λ and the width of the analysis domain is w, the harmonics number rate hm is defined by hm=nw/λ. The size of the Convolution matrix is limited by hm and trc (truncation factor) by the following formula; |i/n|2*trc+|j/n|2*trc<1.0.
The larger hm and the smaller trc, the greater the calculation accuracy but also the greater the memory consumption (hm limited to 5 or less before purchase).
| hm | 5 | 7 | 10 |
|---|---|---|---|
| Matrix size (1D) | 0.71 | 1.00 | 1.43 |
| Matrix size (2D) | 0.712 | 1.00 | 1.432 |
| trc | >10 | 2.0 | 1.0 | 0.0 |
|---|---|---|---|---|
| Truncation shape | ✚ |
◆ |
● |
■ |
| Matrix size (1D) | <0.1 | 0.5 | π/4 | 1.0 |
| Matrix size (2D) | <0.12 | 0.52 | (π/4)2 | 1.0 |
(2) hm and solution stability for transmissivity
The figure below shows the stability of the solution (transmissivity) with respect to hm in the metal disc model with trc fixed (trc=1.0). hm is stable above 5, but there is a difference in behaviour depending on whether the harmonics number n is even or odd, with even numbers being more stable, so Wsr chooses even numbers unless specified otherwise.


The figure below shows the solution stability for transmissivity with respect to hm in the dielectric disc model with fixed trc (trc=1.0). hm is stable above 5, but the difference between even and odd numbers is small.


(3) trc and solution stability for transmissivity
The diagram below shows the stability of the solution (transmissivity) with respect to trc in a metal model comparing a circle plate and a square plate with hm fixed (hm=5.0). The solution is stable for trc less than 3 for the circle and 4 for the square.


The diagram below shows the stability of the solution (transmissivity) with respect to trc in a dielectric model comparing acircular plate and a square plate with hm fixed (hm=5.0). The solution is stable for trc less than 3 for the circle and 4 for the square.


(4) trc and distributions of spatial harmonics
The Spatial harmonics distribution (eps.out) for a circular structure is isotropically spread.

In contrast, the distribution for square structures extends along the 0° and 90° directions.

Therefore, setting trc=1.0 for circular structures and trc=2.0 for square structures causes little degradation in calculation accuracy and compresses memory consumption by a factor of 0.6 and 0.25 respectively.
(5) hm and trc
The setting of hm,trc is one of the approximation operations in the RCWA method, as it restricts the defined area of the Convolution matrix, but it enables significant memory compression and calculation speed-up. The approximation error can also be minimised by appropriate settings of hm and trc. The region restriction by trc is a unique feature of Wsr and can achieve several times higher calculation performance than commercial software.
3. Light sources and boundary conditions for aperiodic structures ▲top
Since the conventional RCWA can only handle light sources with a uniform distribution and a periodic boundary condition for analysis region, the analysis targets are almost limited to the calculation of reflectance, transmittance, and diffraction efficiency. Since WSR can handle distributed light sources and select an absorbed boundary condition, acyclic structures can be calculated and the analysis target is as broad as that for FDTD.● In the case of a distributed light source and a periodic boundary condition (PBC).

● In the case of a distributed light source and an absorbing boundary condition (ABC).

4. Light source position, Top surface and any intermediate surface ▲top
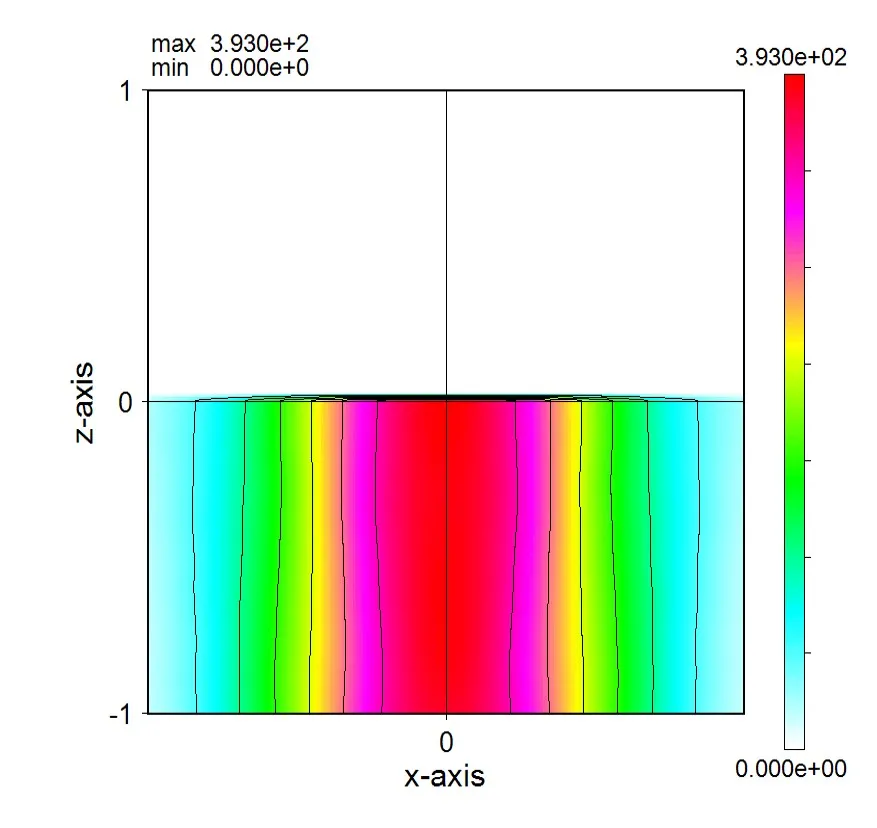
In the conventional RCWA, the light source position was only on the top surface, but in the Wsr, it can be installed at any position in the z direction.● When the light source position is on the top surface.

● When the light source position is in the middle plane.

5. Memory compression ▲top
The disadvantage of RCWA is that it consumes a large amount of memory, but Wsr compresses memory consumption to the limit. For example, since the dielectric constant distribution of a medium homogeneous in the layer is a representation of a sparse matrix, the memory is compressed for that amount. In addition, the matrix size is compressed by the truncation factor trc, and the memory consumption can be reduced to less than 1/4. In proportion to memory compression, the computational speed increases.6. Calculation example for a far field in the lower and upper sides ▲top
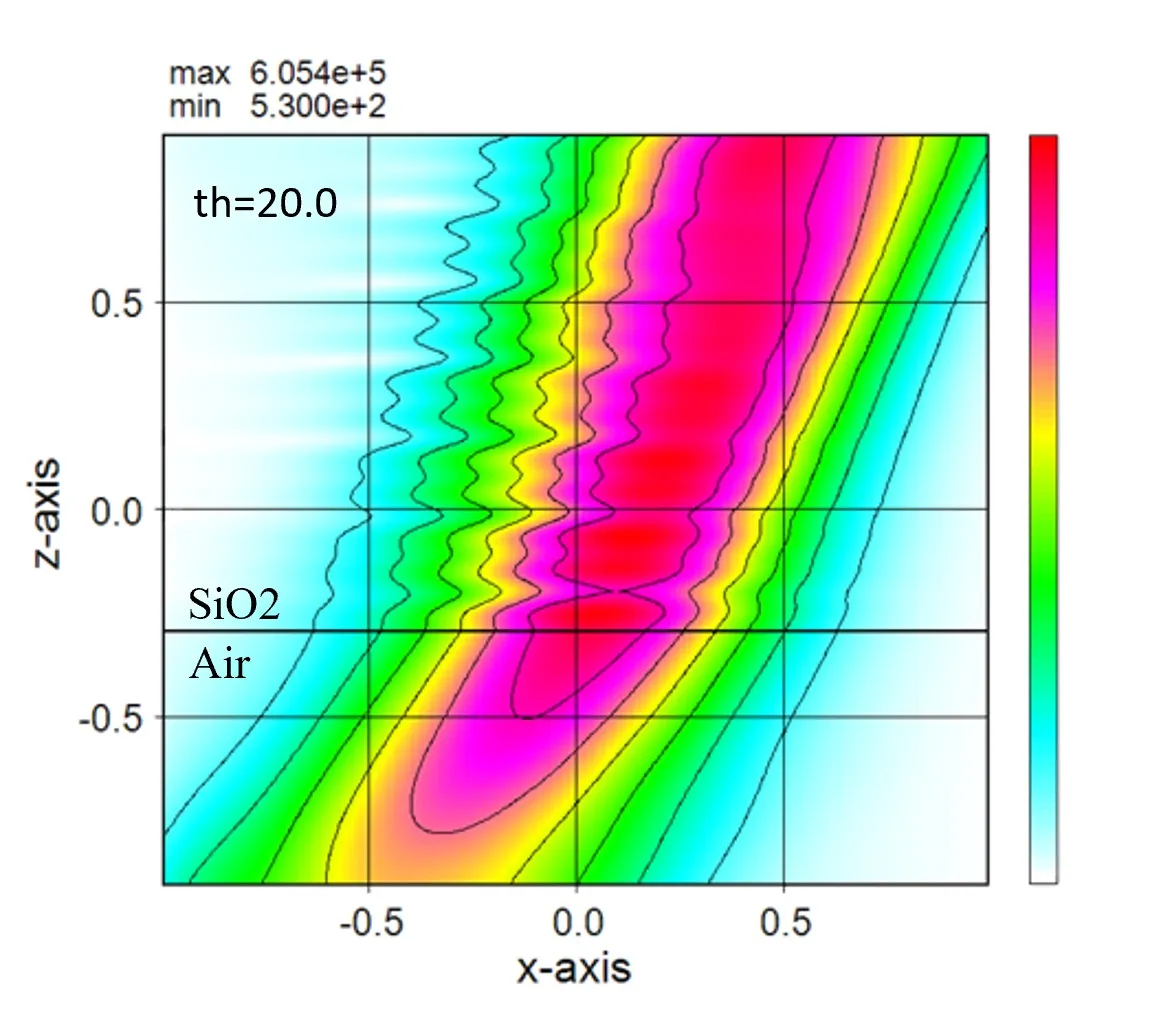
● Inclined light propagates from the top surface to the bottom surface.
● Far field pattern in the lower side.

● Far field pattern in the upper side.

7. Measurement of light amount ▲top
● The amount of light input and output and the amount of light absorbed can be measured individually for each material or area.
● Measurement result for each material region.
8. Cross-sections for various structures ▲top
● In the case of internal definition.
● In the case of external definition using sub.dat.
The isolated structure can be defined by the four points (x1,y1), (x2,y2), (x3,y3), and (x4,y4) described in sub.dat.

The structure defined by the piled data of four points. A periodic pattern for these structures can be defined easily.

9. Calculation example for lens focusing ▲top
● The lens shape is expressed by stacking the internally defined circular structure.
● The lens shape is expressed by stacking the externally defined circular structure.

10. Calculation of diffraction efficiency ▲top
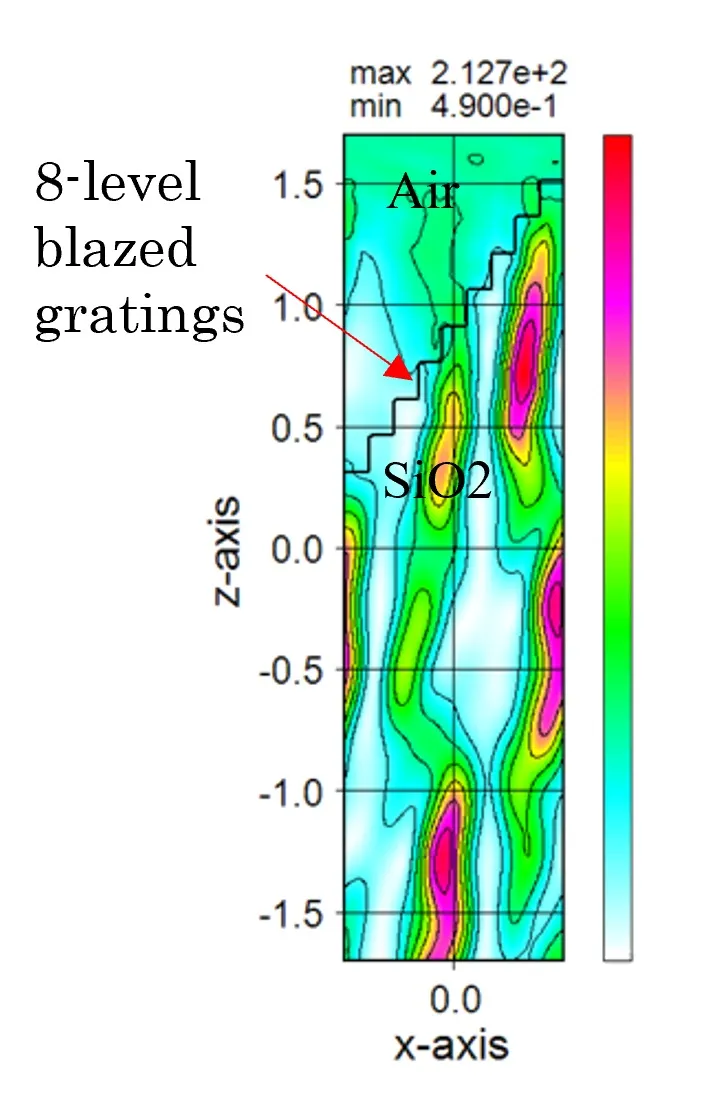
● Light intensity distribution for uniform intensity incidence on 8-level blazed gratings under periodic boundary conditions.
● Wavelength dependence of diffraction efficiency on the model shown above.

11. Visualizing the calculation results ▲top
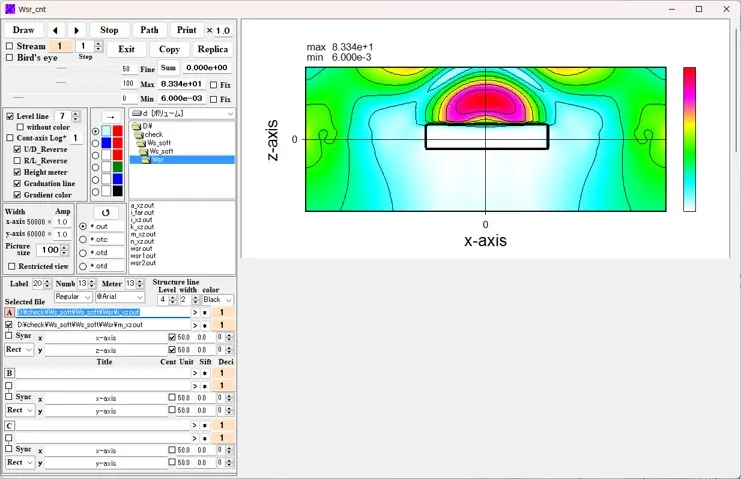
● At runtime, the calculation results are displayed in real time by Wscnt.
12. Output files ▲top
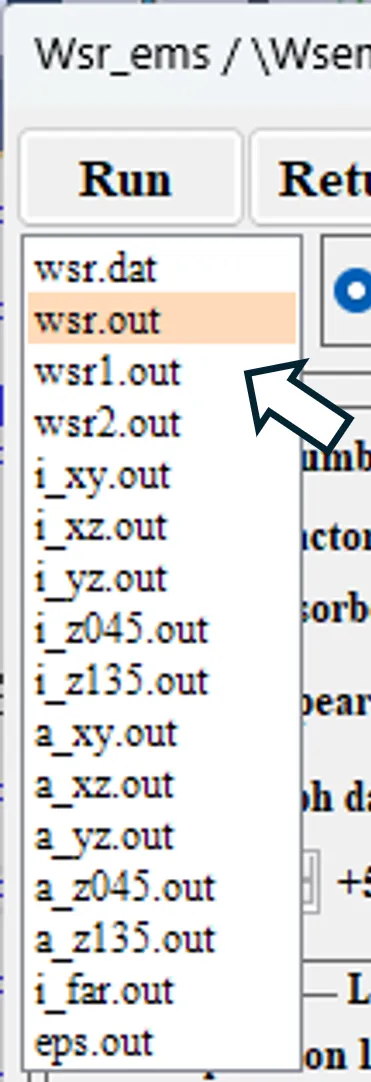
The contents of each output file are described based on the contents displayed by double-clicking the item in the Result file box on the Source setting window.
● wsr.out Main calculation results.

● wsr1.out Extracted calculation results.

● wsr2.out Diffraction efficiencies for diffraction orders from -1st to +1st.

● i_xy.out xy cross-sectional distributions of light intensity.


drawing example.
● i_xz.out xz cross-sectional (y=csy) distributions of light intensity.


drawing example.

● i_yz.out yz cross-sectional (x=csx) distributions of light intensity.


drawing example.

● i_z045.out Cross-sectional distribution with 45-degrees rotation around z-axis for light intensity.


drawing example.

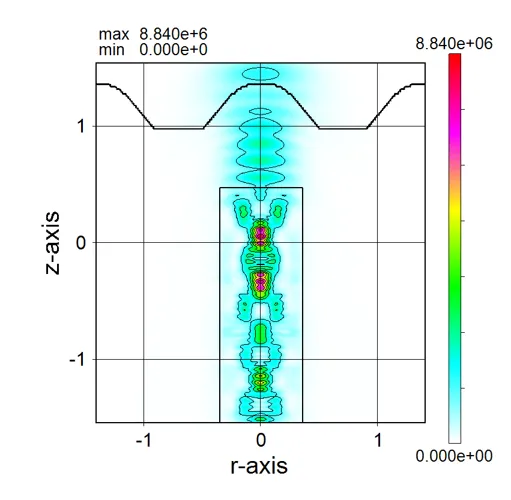
● i_z135.out Cross-sectional distribution with 135-degrees rotation around z-axis for light intensity.


drawing example.

● a_xy.out xy cross-sectional distributions of absorption.


drawing example.
● a_xz.out xz cross-sectional (y=csy) distributions of absorption.


drawing example.

● a_yz.out yz cross-sectional (x=csx) distributions of absorption.


drawing example.

● a_z045.out Cross-sectional distribution with 45-degrees rotation around z-axis for absorption.


drawing example.

● a_z135.out Cross-sectional distribution with 135-degrees rotation around z-axis for absorption.


drawing example.

● i_far.out Far-field intensity distributions.

drawing example.

● eps.out Spatial harmonics distribution.

drawing example.
