Calculation progress monitoring software : Wsmnt
To Japanese
● 1. Specifying a drawing file and displaying file contents
● 2. Drawing line charts, selecting charts
● 3. Horizontal axis extraction, real-time graph drawing
● 4. Setting the graph conditions
● 5. Replaying past settings
The calculation progress of Wsf is displayed in line diagrams. Normally, it is automatically started and graphs are drawn by Wsems, but here we will explain how to operate it manually.

(2) When you click the * button ⑧, the background color of the box ⑥ changes to yellow, and the file contents are displayed in the box below. The contents of the file are described for each column such as ⑨, ⑩, ⑪, and ⑫. The item names are described in the first row, and the numerical data is described in the second and subsequent rows. The item names are also indicated in the box ⑬. The file contents can be copied to the clipboard by clicking the Copy button ⑭.
(2) If you check some of the boxes as shown in ④ and click the Draw button ①, only the graphs of the checked items are drawn. Click the Clear button ⑤ to cancel the selection of all items, and click the All button ⑥ to select all items. Click the Copy button ⑦ to copy the drawing image to the clipboard. When you specify an area on the image with "Drop down & up" and click the Copy button ⑦, the image in the specified area is cut out and copied to the clipboard. Click the Print button ⑧ to print.



● 2. Drawing line charts, selecting charts
● 3. Horizontal axis extraction, real-time graph drawing
● 4. Setting the graph conditions
● 5. Replaying past settings
The calculation progress of Wsf is displayed in line diagrams. Normally, it is automatically started and graphs are drawn by Wsems, but here we will explain how to operate it manually.
1. Specifying a drawing file and displaying file contents ▲top
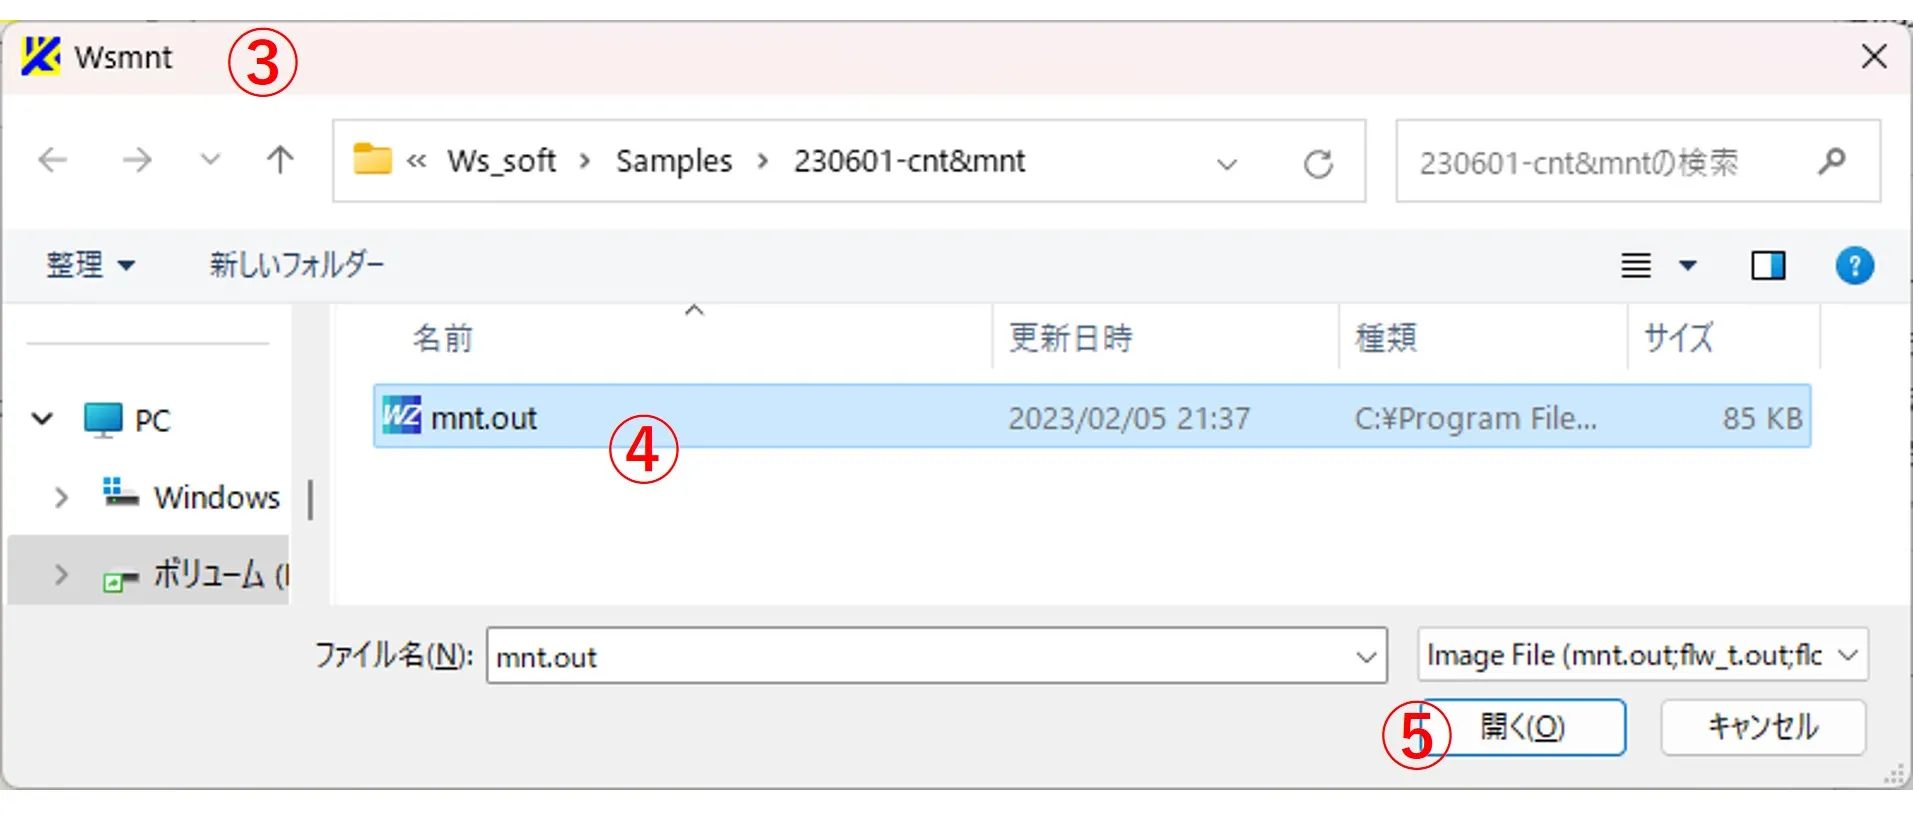
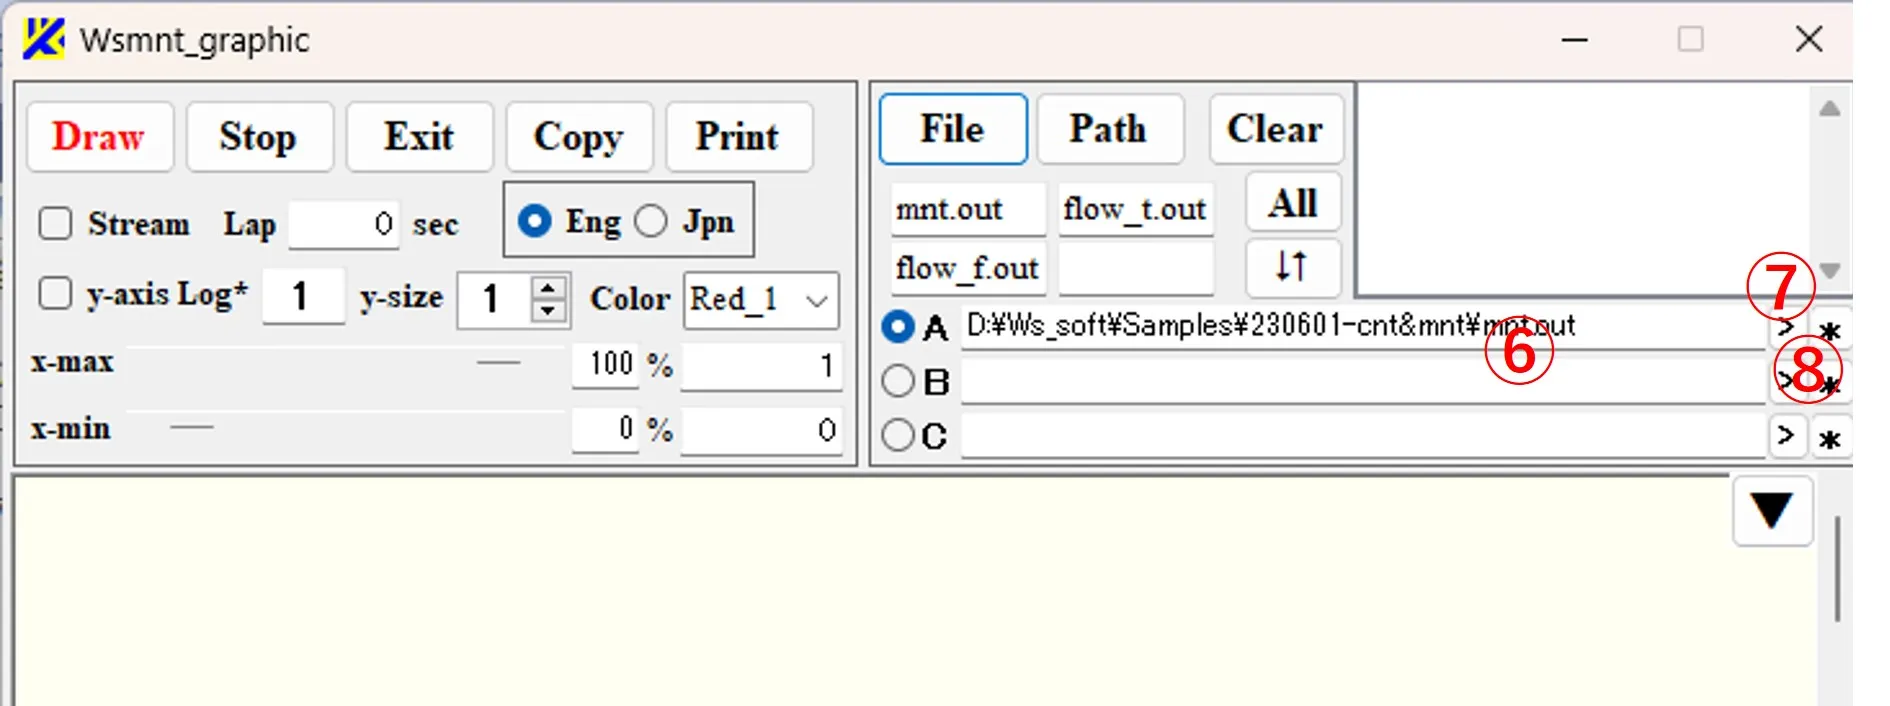
(1) Double-click the wsmnt.exe in \ws_soft\wsems to open the main screen of Wsmnt. When the selection button ① is checked and the File button ② is clicked, the file selection window ③ appears. When the file ④ of mnt.out is selected and the button Open ⑤ is clicked, the path and the file name are described in the box ⑥. If the file name is long and protrudes from the box ⑥, you can slide it by clicking the button ⑦.


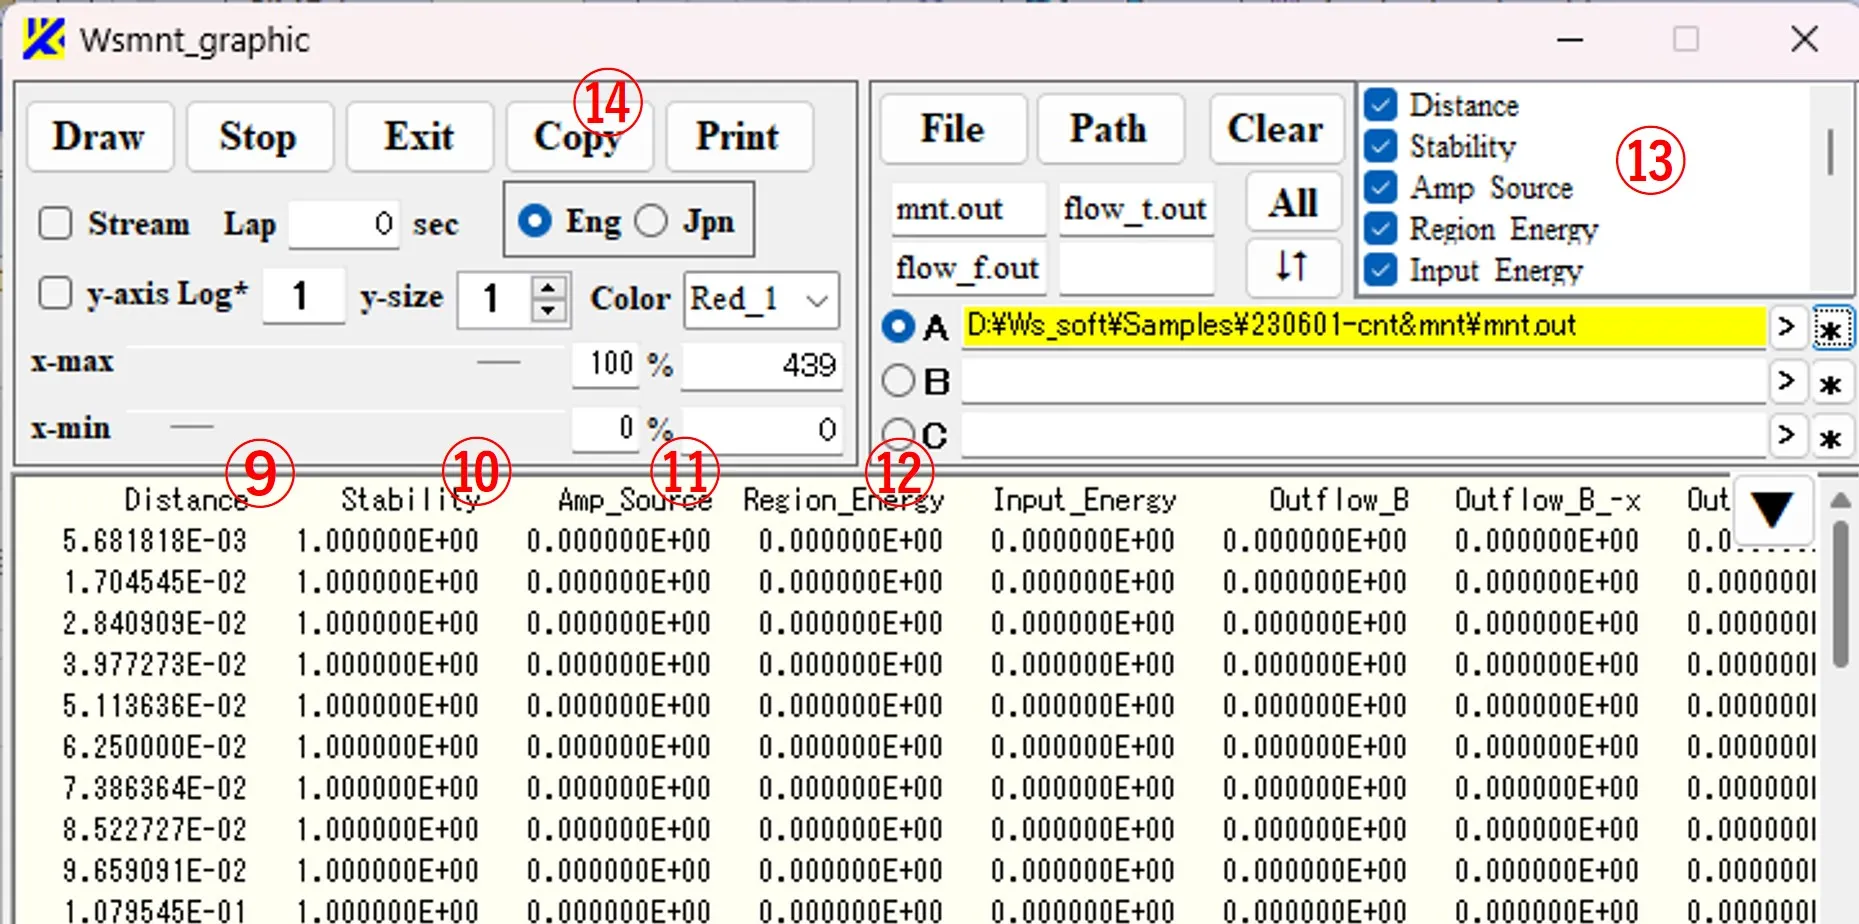
(2) When you click the * button ⑧, the background color of the box ⑥ changes to yellow, and the file contents are displayed in the box below. The contents of the file are described for each column such as ⑨, ⑩, ⑪, and ⑫. The item names are described in the first row, and the numerical data is described in the second and subsequent rows. The item names are also indicated in the box ⑬. The file contents can be copied to the clipboard by clicking the Copy button ⑭.

2. Drawing line charts, selecting charts ▲top
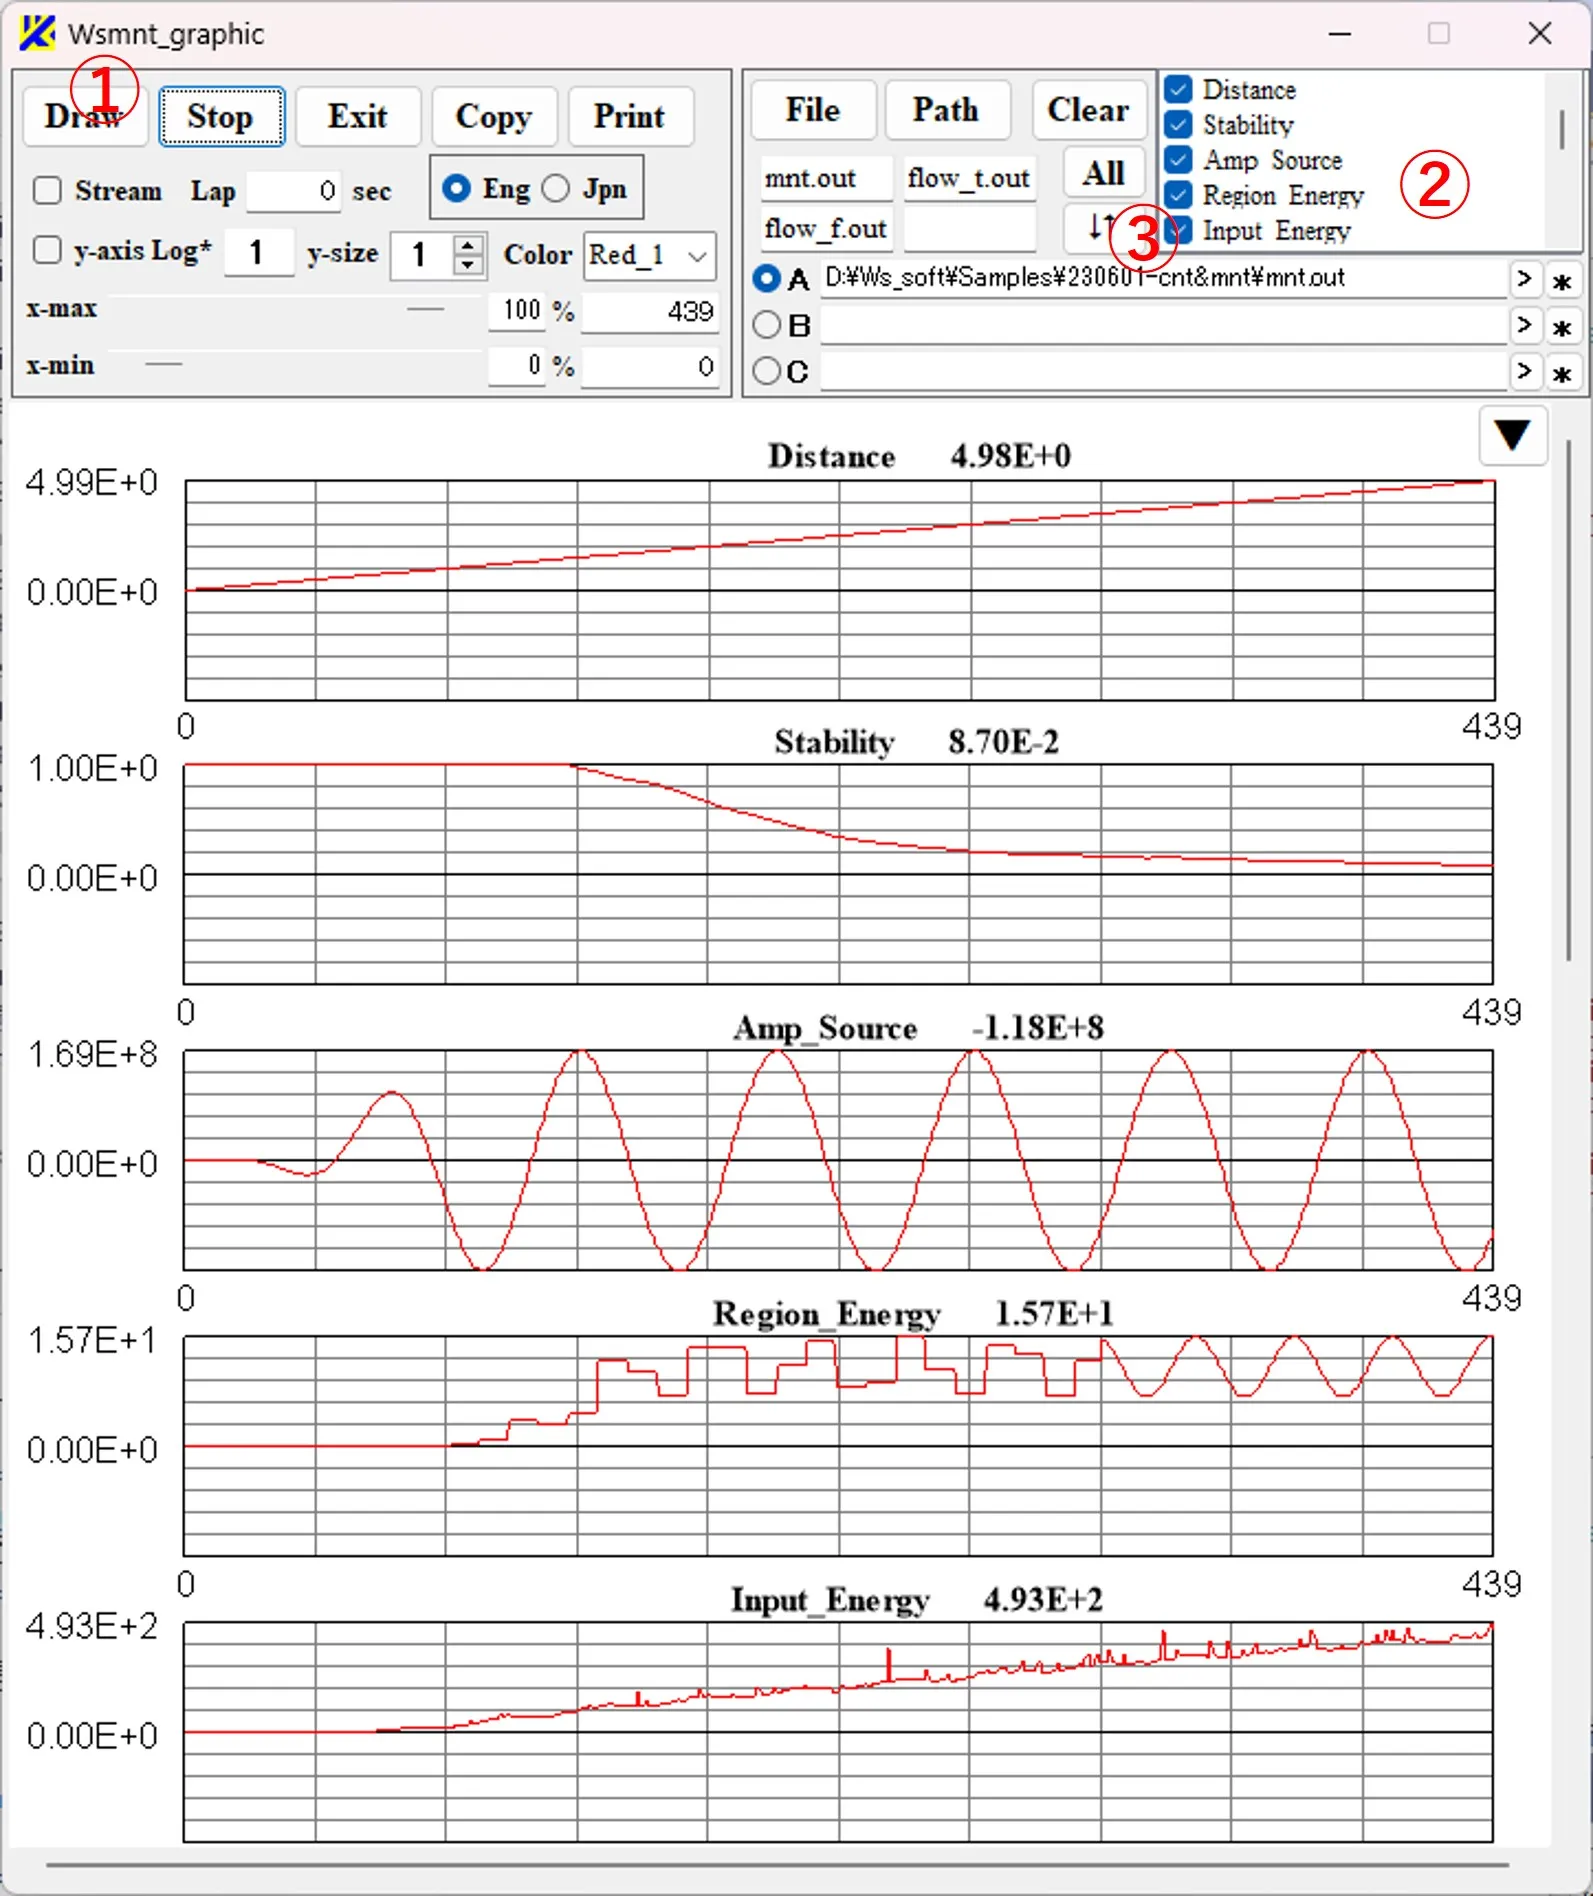
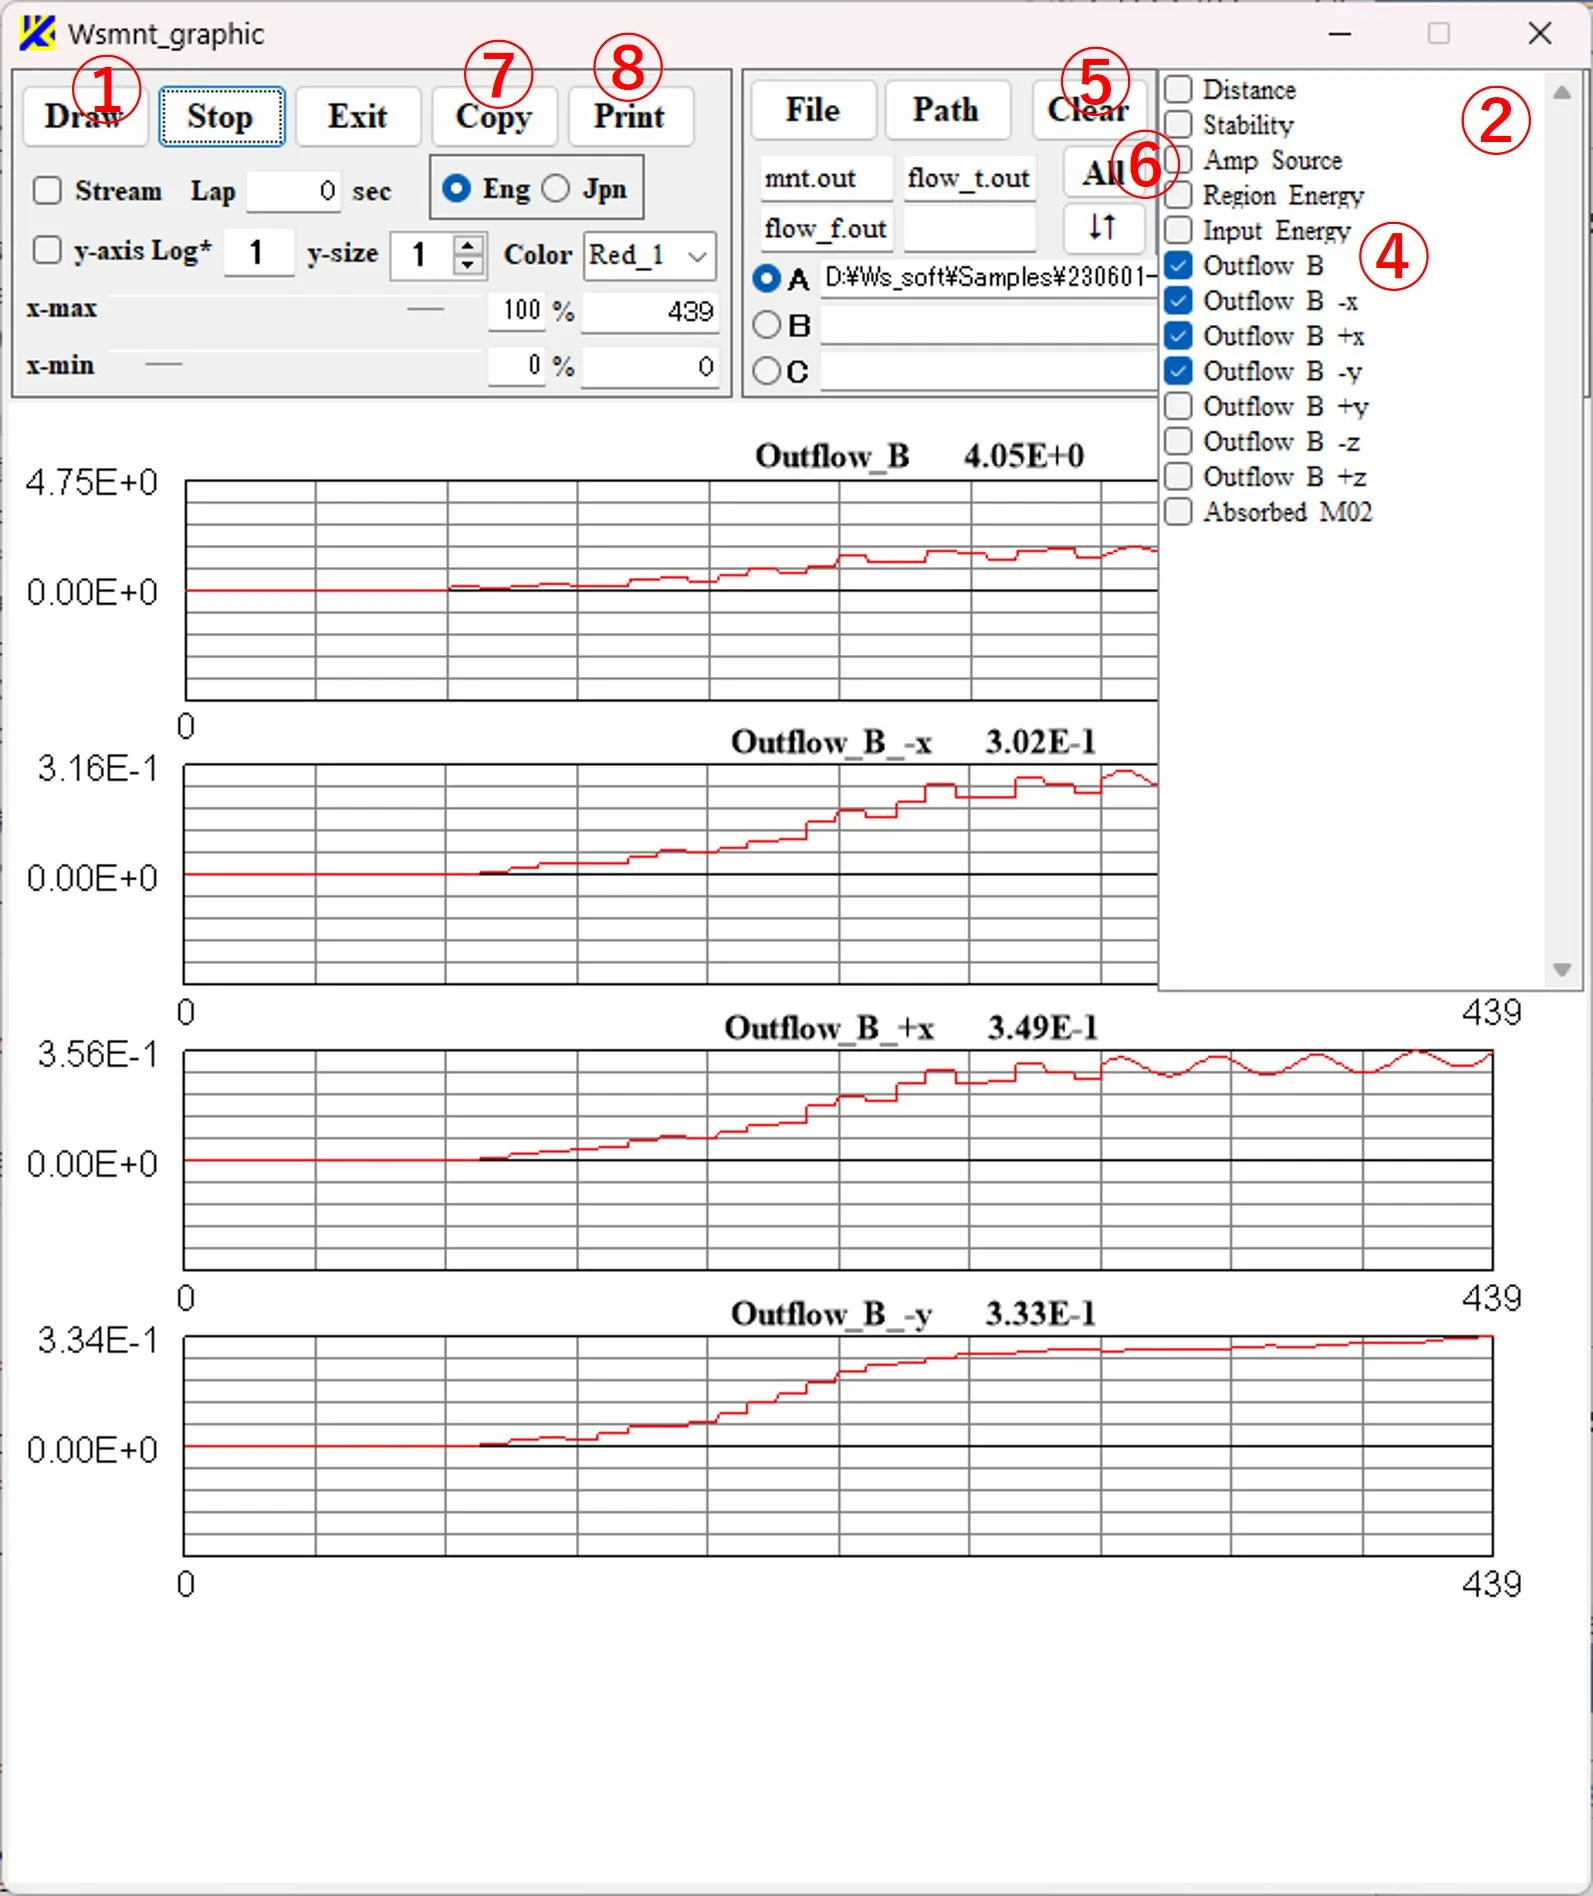
(1) When the Draw button ① is clicked, a graph of numerical data (vertical axis) for the row number (horizontal axis) is drawn for each item. Right-click on box ② (or click button ③) to expand the height of the box downward. Click again to return to the original.
(2) If you check some of the boxes as shown in ④ and click the Draw button ①, only the graphs of the checked items are drawn. Click the Clear button ⑤ to cancel the selection of all items, and click the All button ⑥ to select all items. Click the Copy button ⑦ to copy the drawing image to the clipboard. When you specify an area on the image with "Drop down & up" and click the Copy button ⑦, the image in the specified area is cut out and copied to the clipboard. Click the Print button ⑧ to print.

3. Horizontal axis extraction, real-time graph drawing ▲top
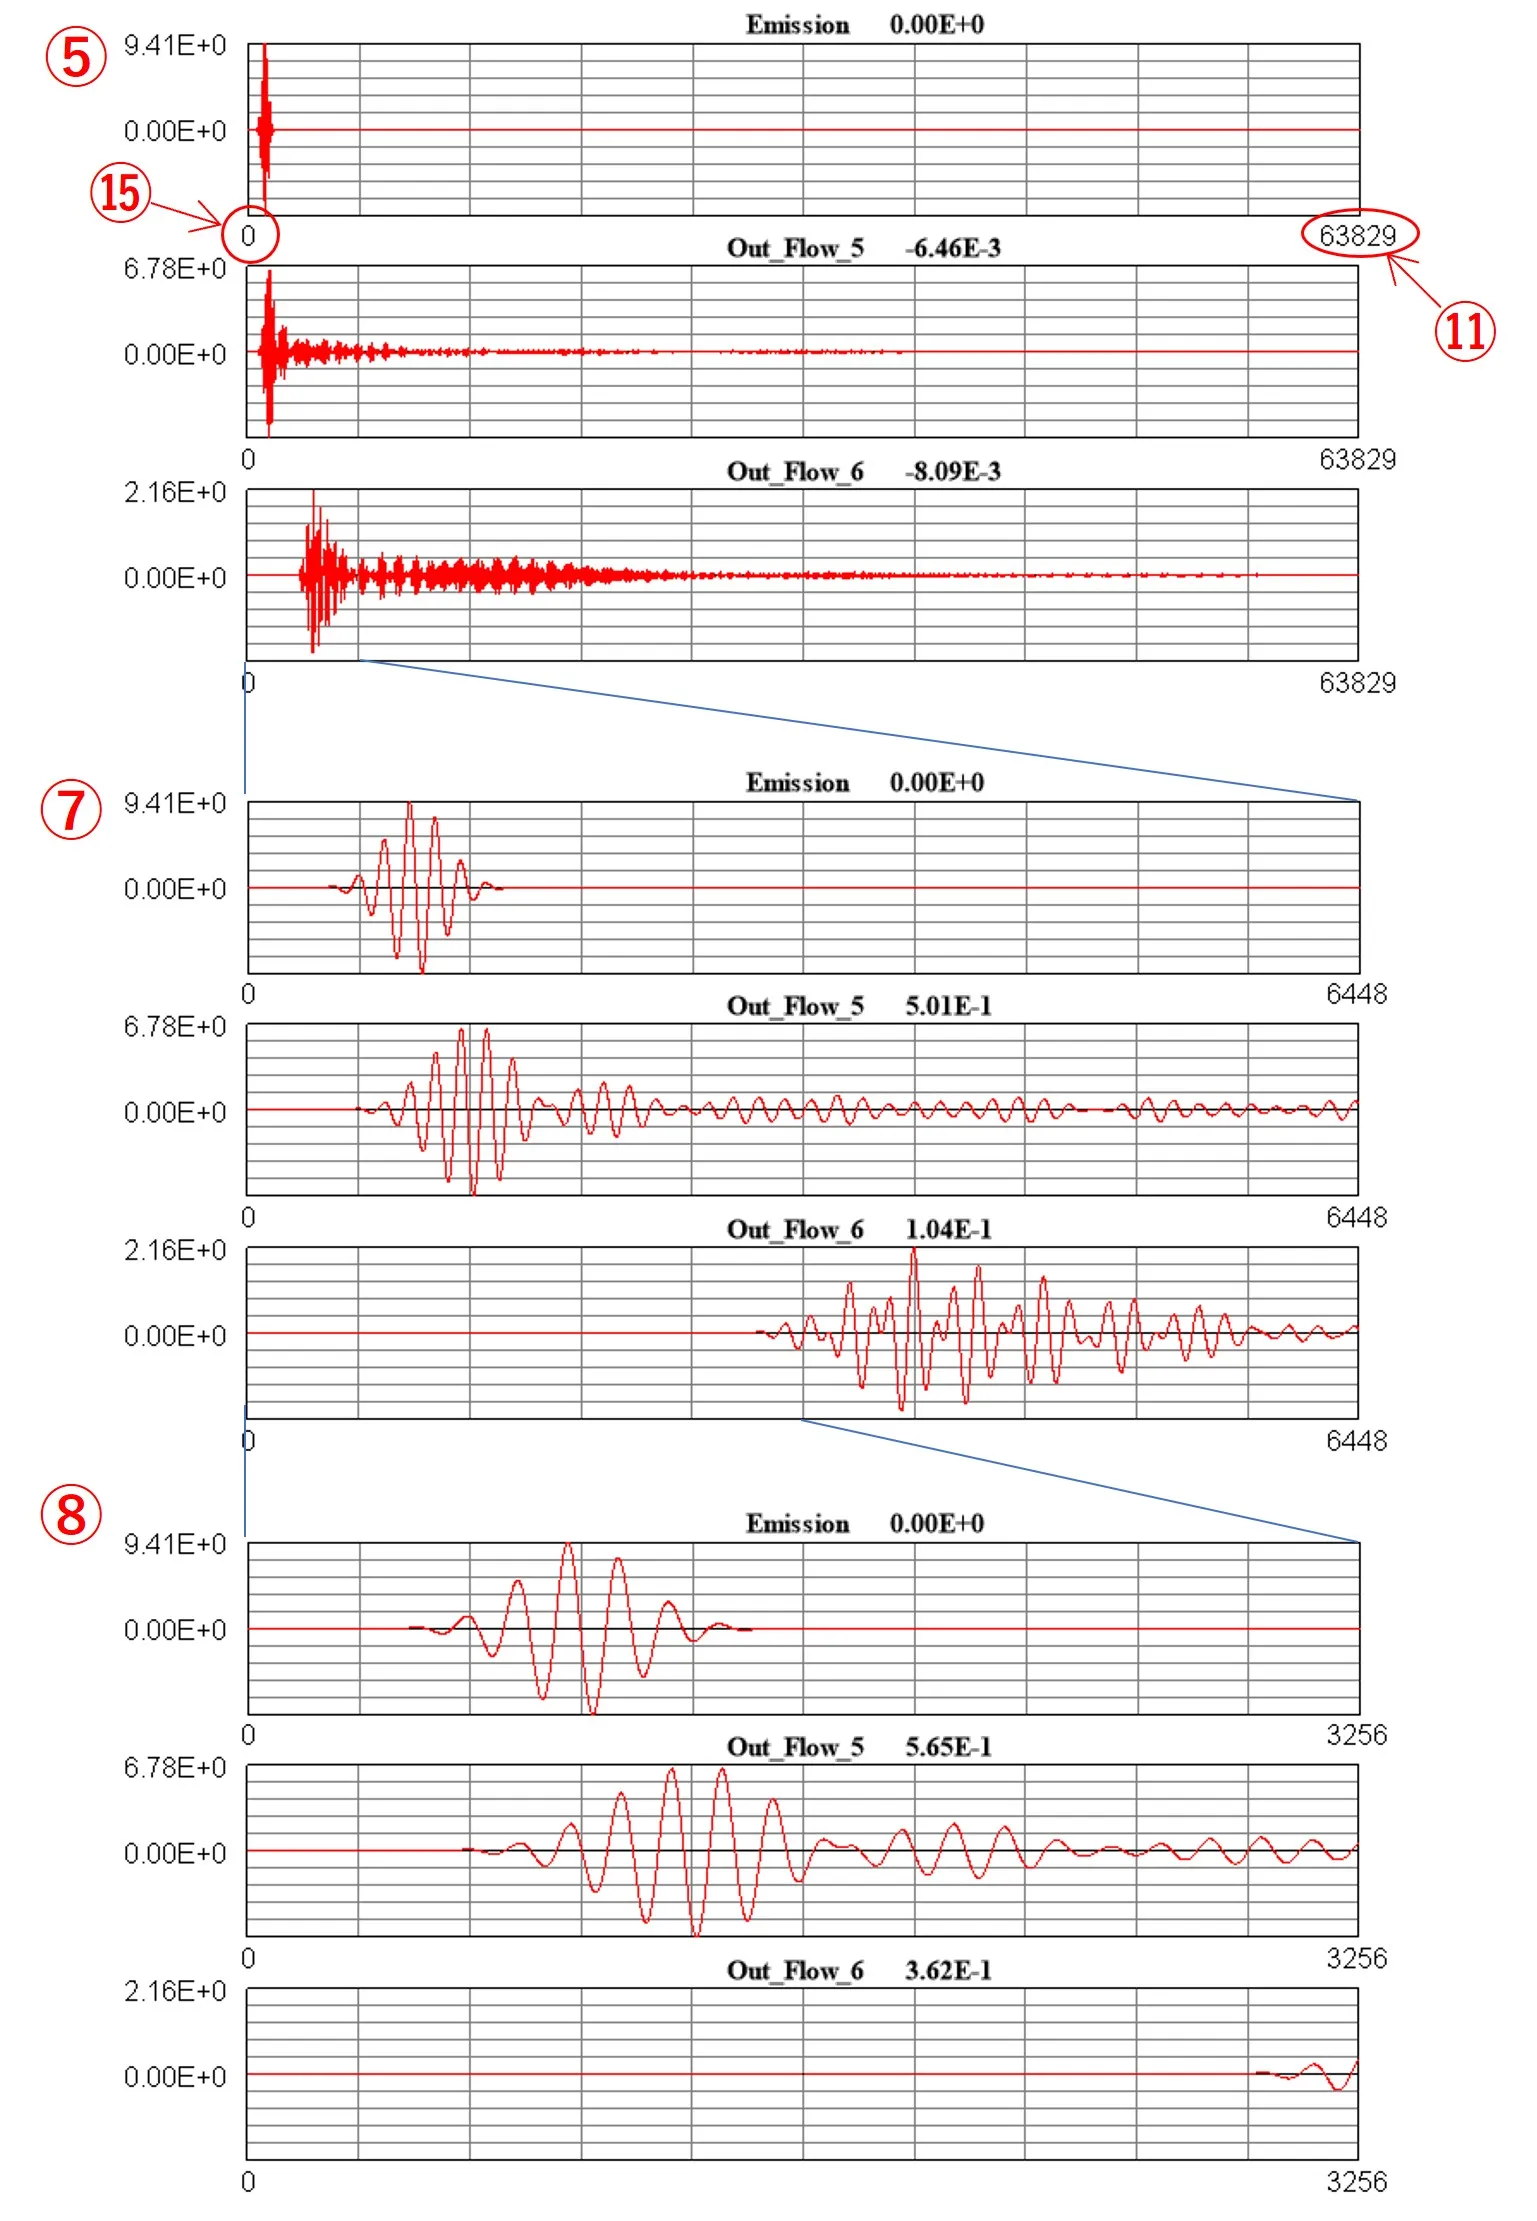
Click the File button ① to select a new file ② (flow_t.out), check the exclusion items as shown in ③ and click the Draw button ④ to draw the graph ⑤. When the scroll bar ⑥ is scrolled, the percentage box ⑨ and the row position box ⑩ change in conjunction (the row position ⑩ is reflected in the maximum value ⑪ on the horizontal axis of the graph). When the Draw button ④ is clicked, the drawing result is enlarged and reduced in the horizontal axis direction as shown in ⑦ and ⑧. Similarly, when the scroll bar ⑫ is scrolled, the percentage box ⑬ and the row position box ⑭ change in tandem and are reflected in the minimum value ⑮ of the drawing result. When the file ② is being calculated and is in the process of being updated, after checking the Stream box ⑯, clicking the Draw button ④ updates the drawing result in real time in the direction where the maximum value of the horizontal axis is extended, and the progress of the calculation can be confirmed.

4. Setting the graph conditions ▲top
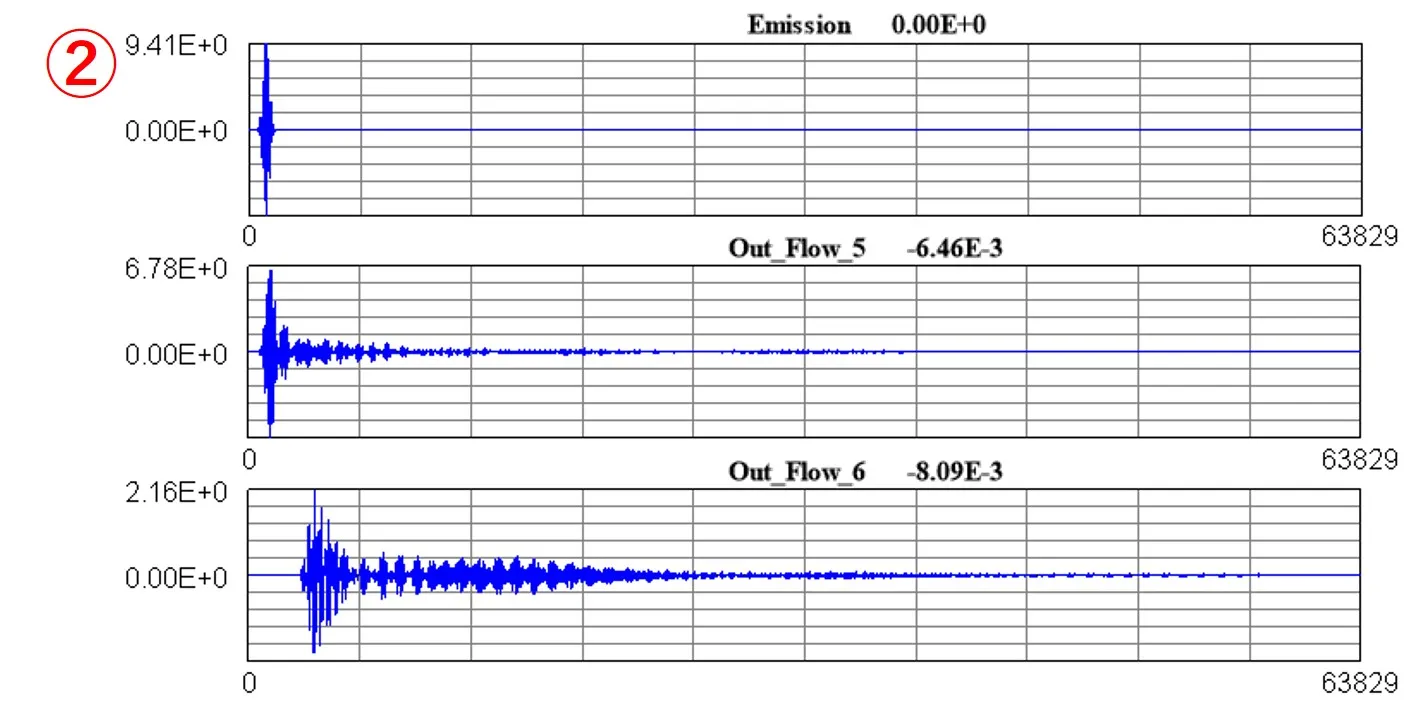
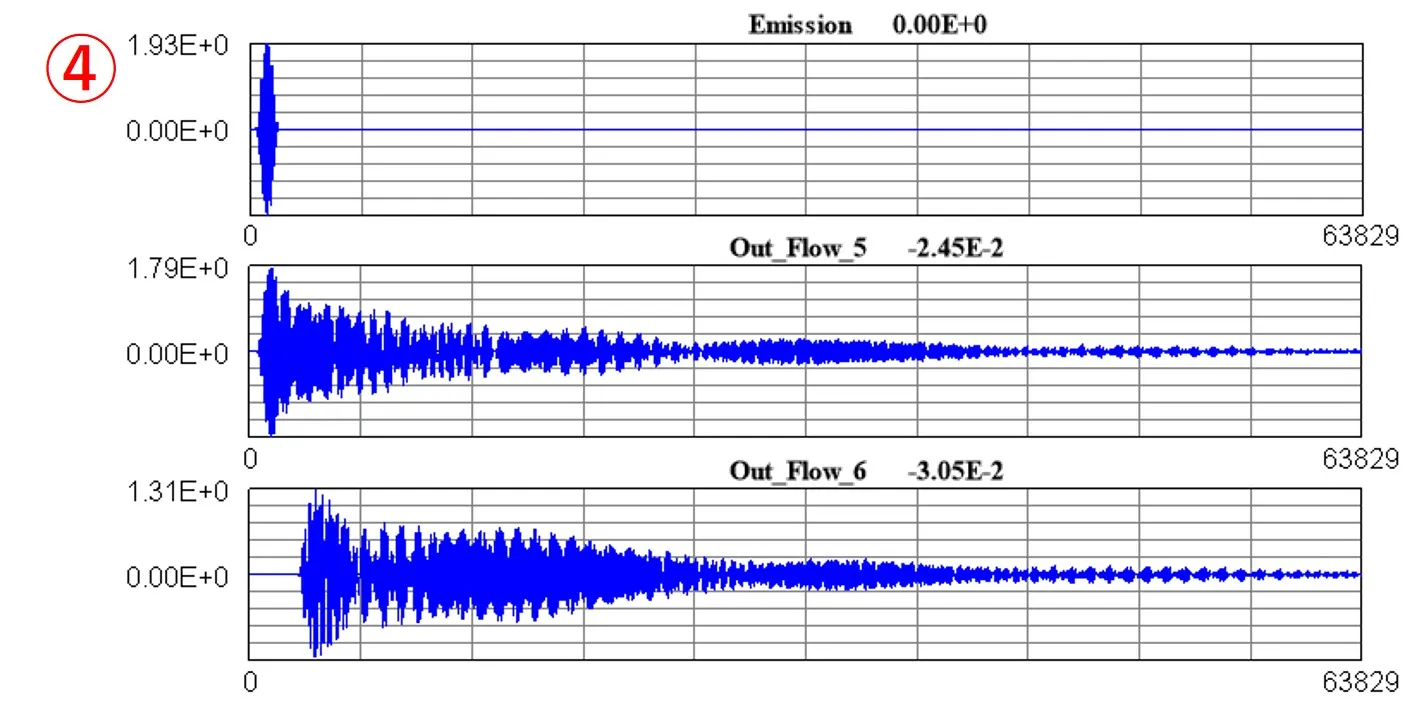
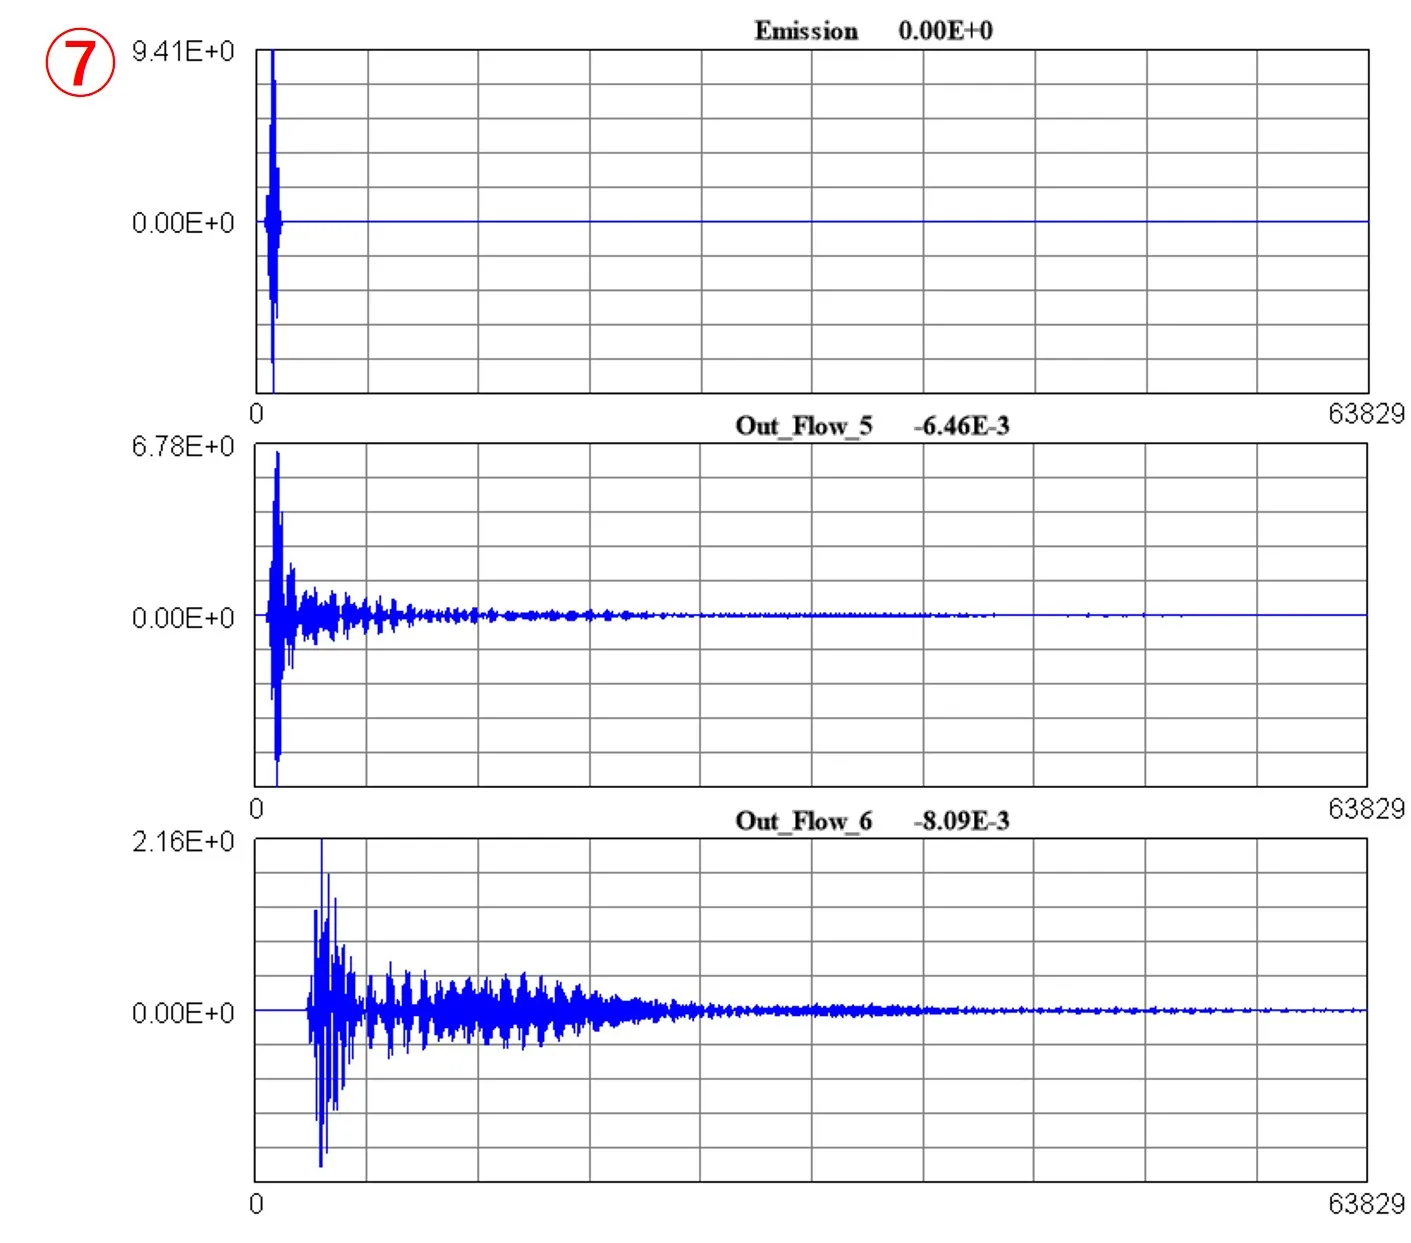
The color and thickness of the graph ② can be selected by the Color box ①. When the box ③ is checked, the y-axis changes from the Linear scale to the Log scale as shown in the graph ④. The valu of the box ⑤ is the exponent n of the Log scale, according to the definition of y'(Log scale value)=sign(n*log10(9*|y|+1),y), the higher the n, the more the low frequency is emphasized. The y-axis can be enlarged and contracted by the y-size box ⑥. The graph ⑦ is an example in which the value of the box ⑥ is set to 2 with respect to the graph ②.


5. Replaying past settings ▲top
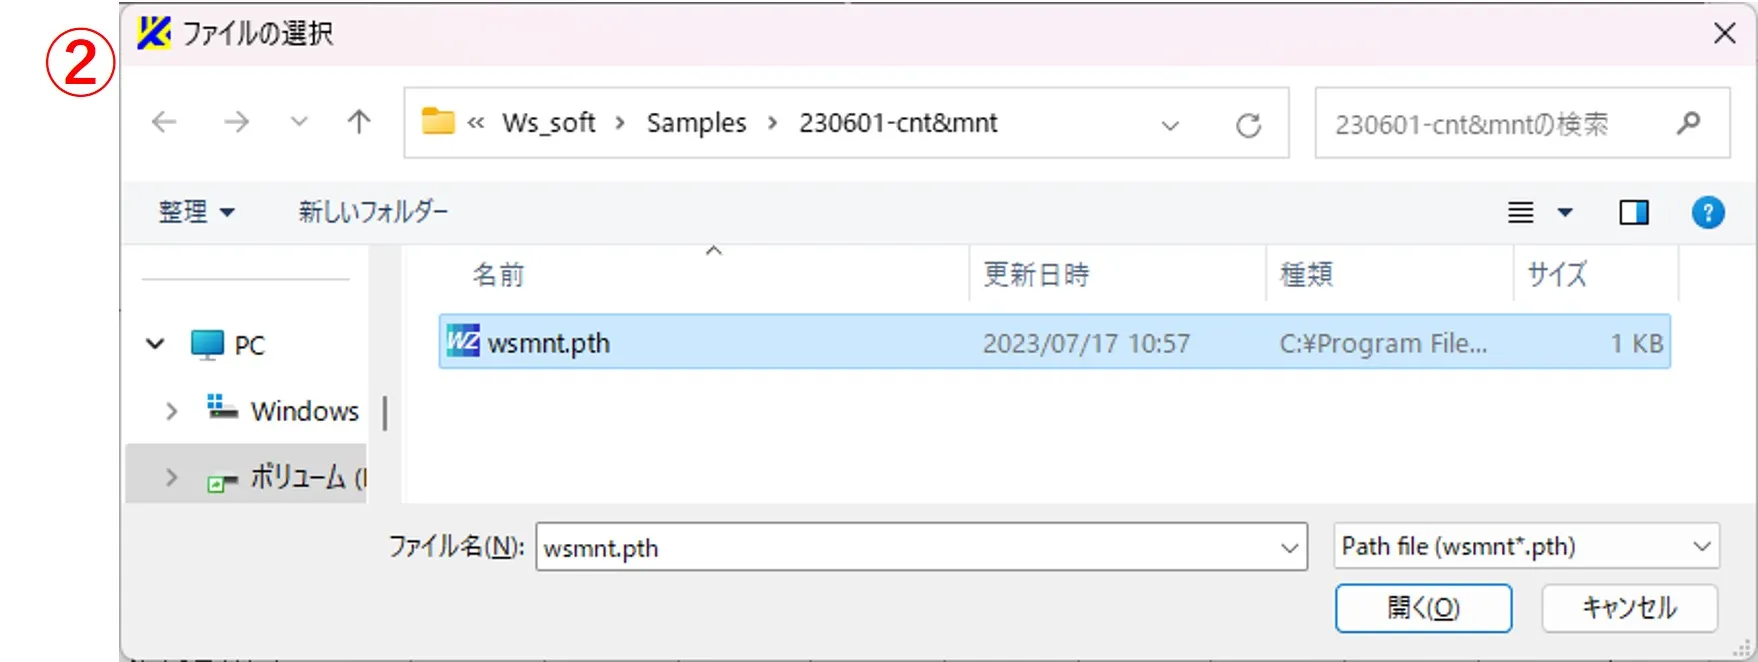
When the Path button ① is clicked, the file selection window ② appears, and when the file of wsmnt.pth is selected as a target from here, the settings performed in the past are reproduced. wsmnt.pth is created (overwritten) in the folder containing the Wsmnt.exe and in the folder listed in the file path box (on the right side of the file selection button ⦿) each time the Draw button is pressed.
