BPM electromagnetic field analysis software : Wsb
To Japanese
● 1. Calculation principle and Babinet's principle
● 2. Types of boundary conditions, PBC and ABC
● 3. Calculation of transmitted light and reflected light
● 4. Fresnel's reflection, Snell's law and polarization calculation
● 5. Calculation for a far field in the lower and upper sides
● 6. Measurement of light amount
● 7. Cross-sections for various structures
● 8. Calculation for lens focusing
● 9. Visualizing the calculation results
● 10. Output files New 2024/11/12
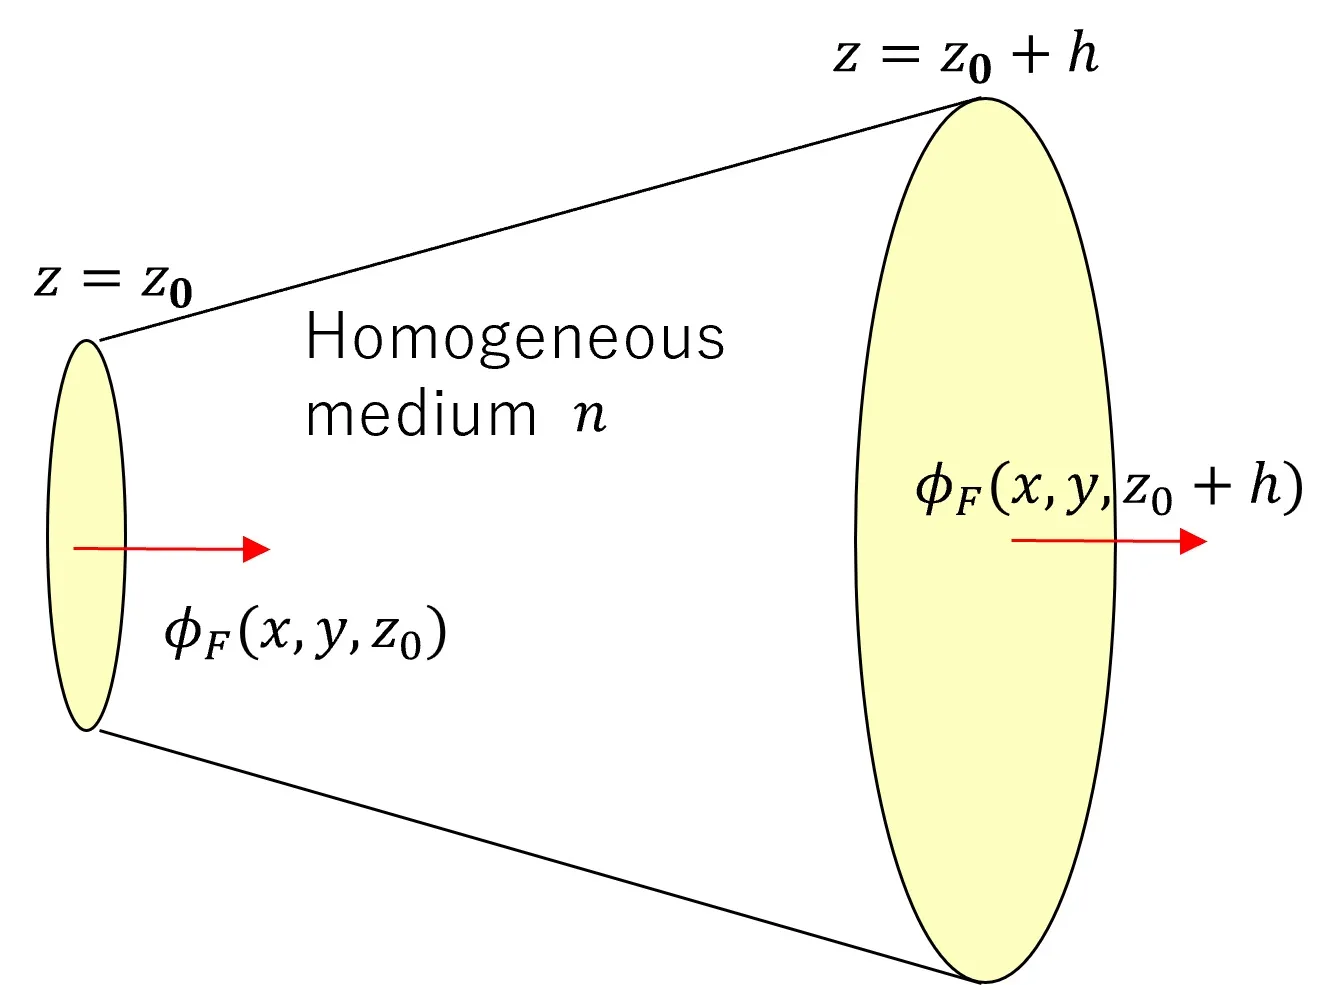
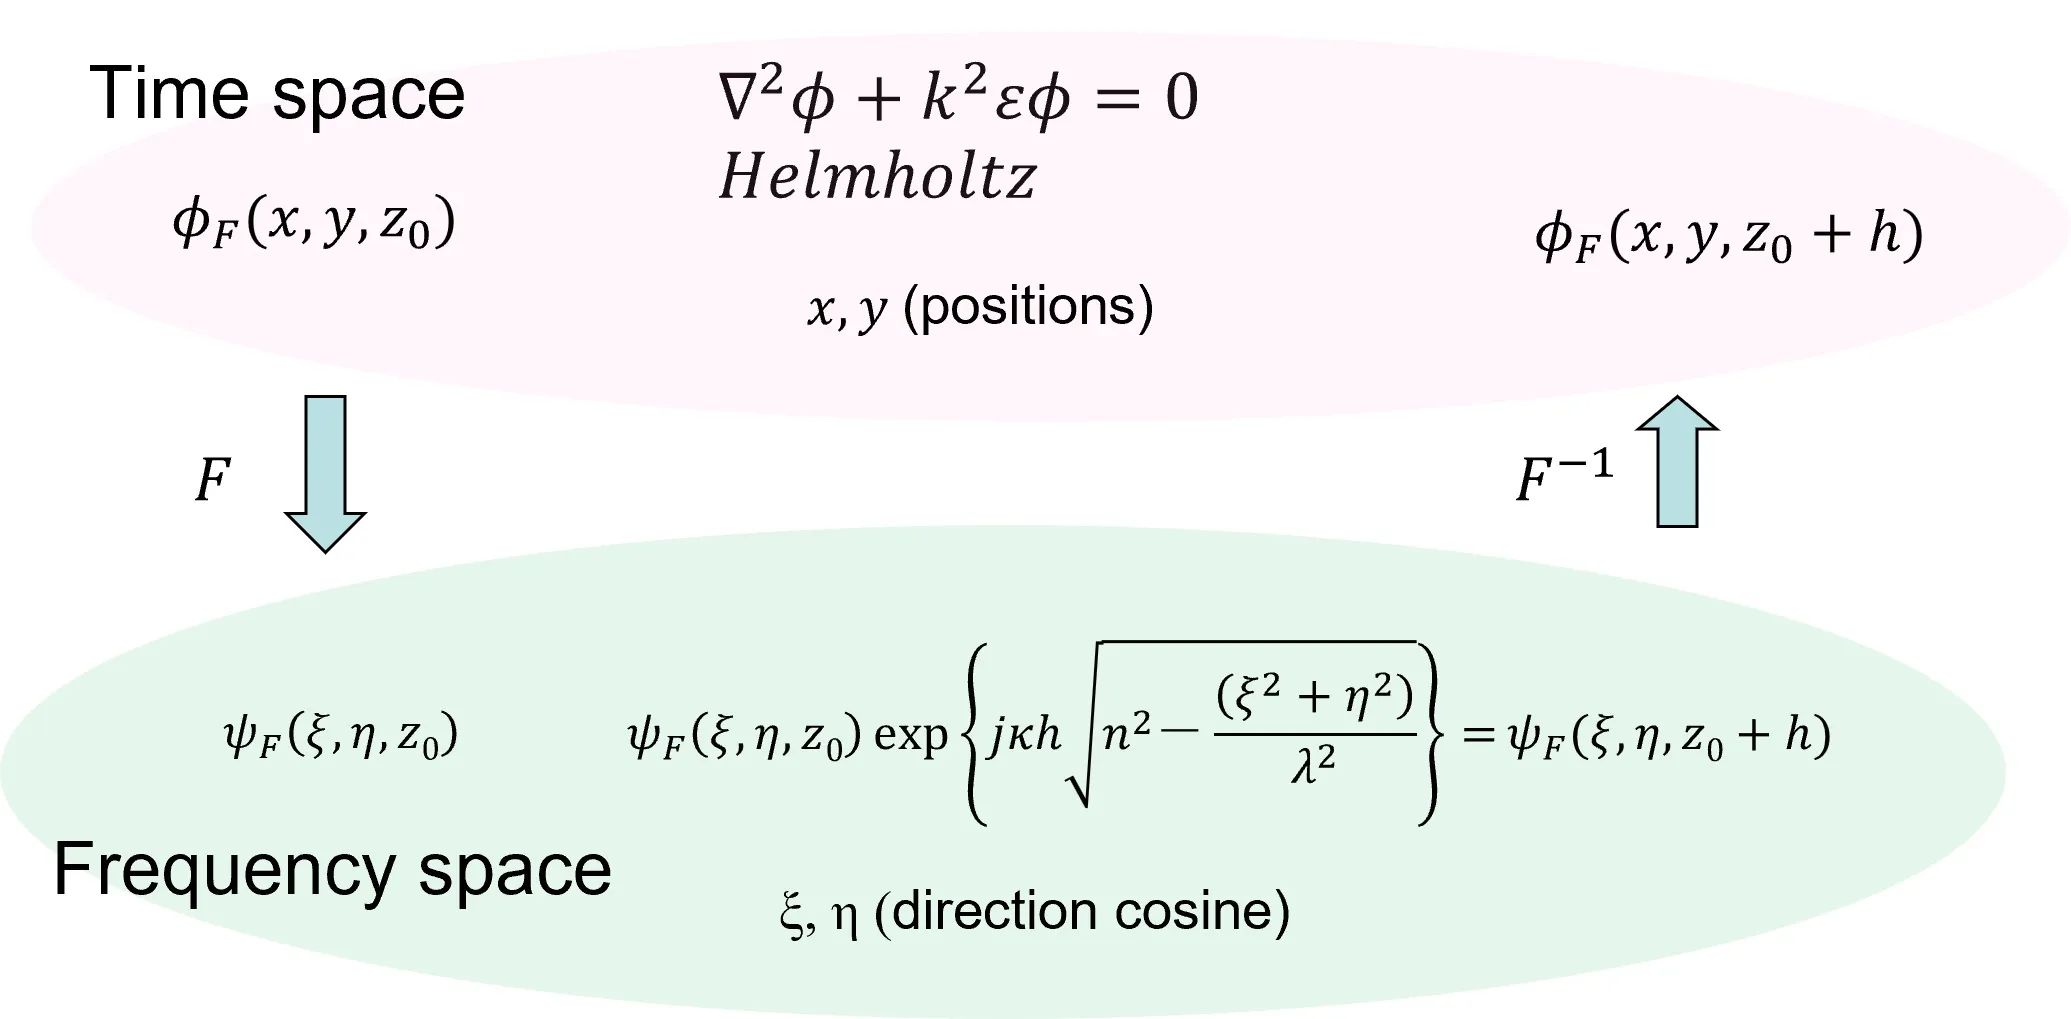
(1) Propagation in a homogeneous medium can be calculated by repeated FFT based on the Helmholtz’s equation (i.e., FFT-BPM), which is a rigorous wave equation in a homogeneous medium.
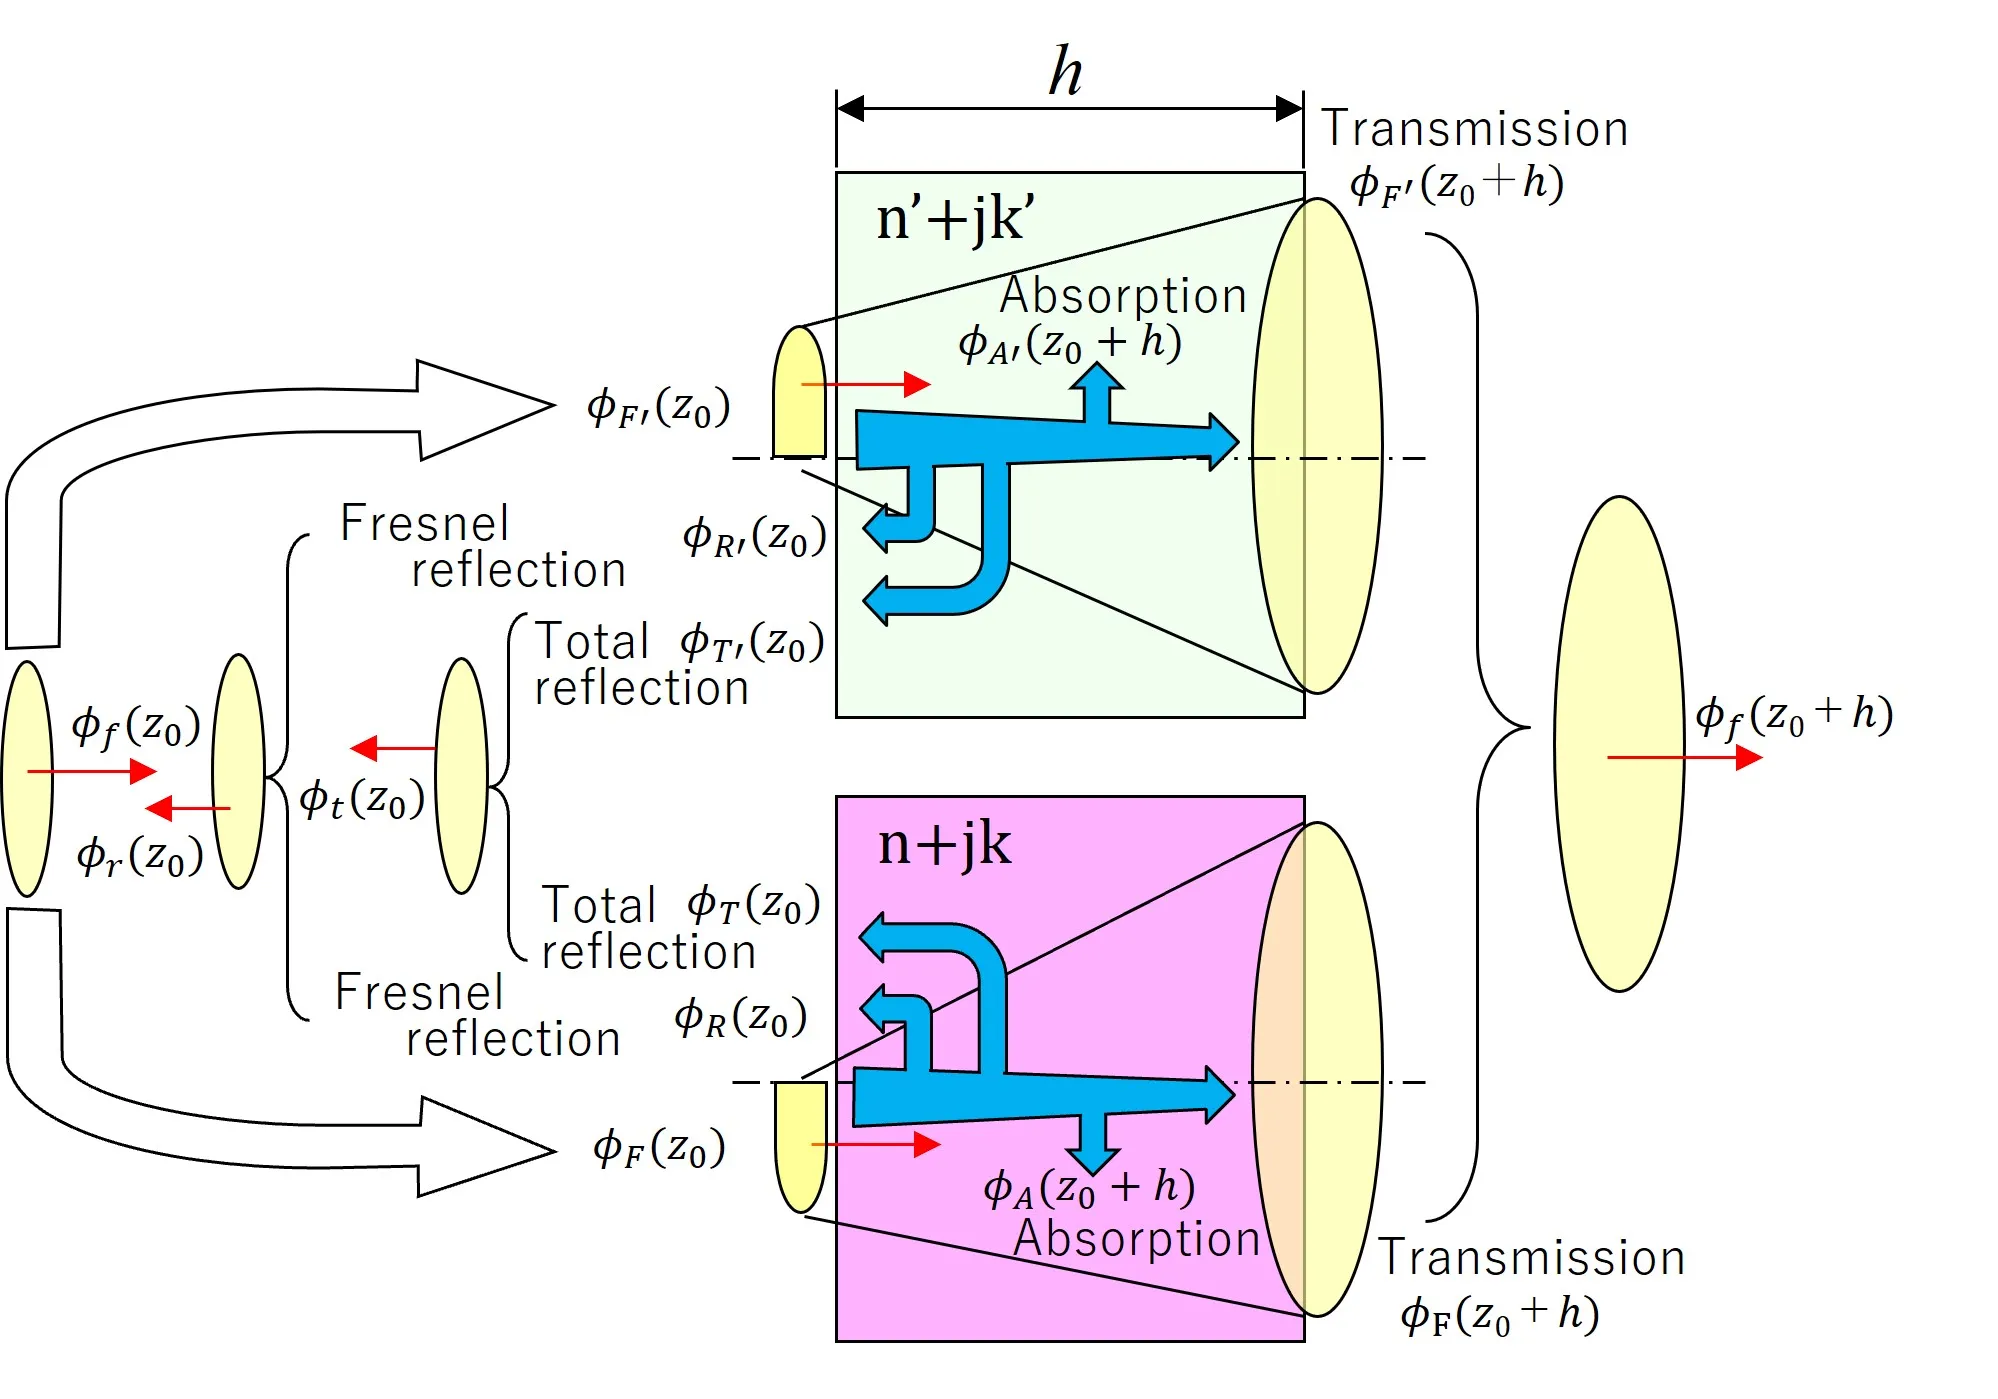
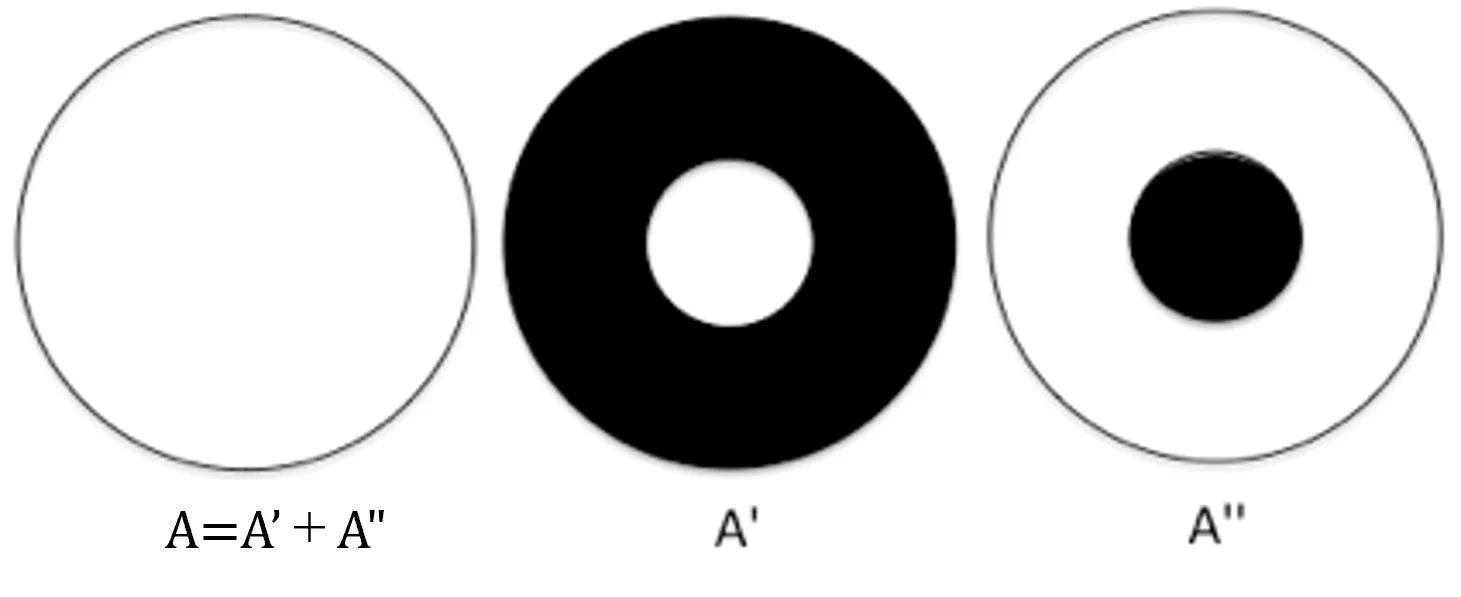
(2) Light distribution is divided into regions of different refractive index media at refractive surfaces, and propagation is calculated for each forward and return path. Based on differences in characteristics in a frequency space, light incident on the refractive surfaces is classified into four types: transmitted light and evanescent light on the forward path, Fresnel reflection light and total reflection light on the return path, and each is combined to express the accurate propagation based on the Babinet's principle, where evanescent light is a decay component radiating total reflection light. Since Fresnel reflection is considered at the refractive surfaces, polarization can be handled. The process of synthesizing light distributions passing through complementary regions is the same as the Babinet‘s principle and it is a calculation method in which the energy change under the operation is very small (that is, energy conservation is nearly satisfied).
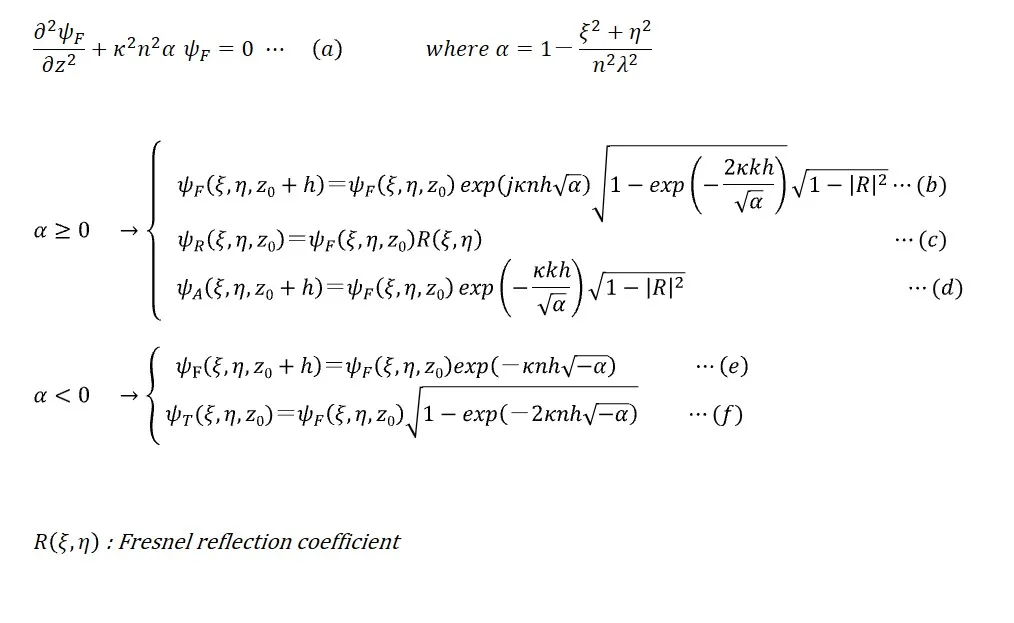
(3) The calculation formulas for each light distribution in the above figure are shown below.
(Reference) Babinet's principle
For diffraction due to complementary screens A' and A", the relationship of uA'+uA"=uA holds where complexed amplitudes of diffractive light are uA' and uA".
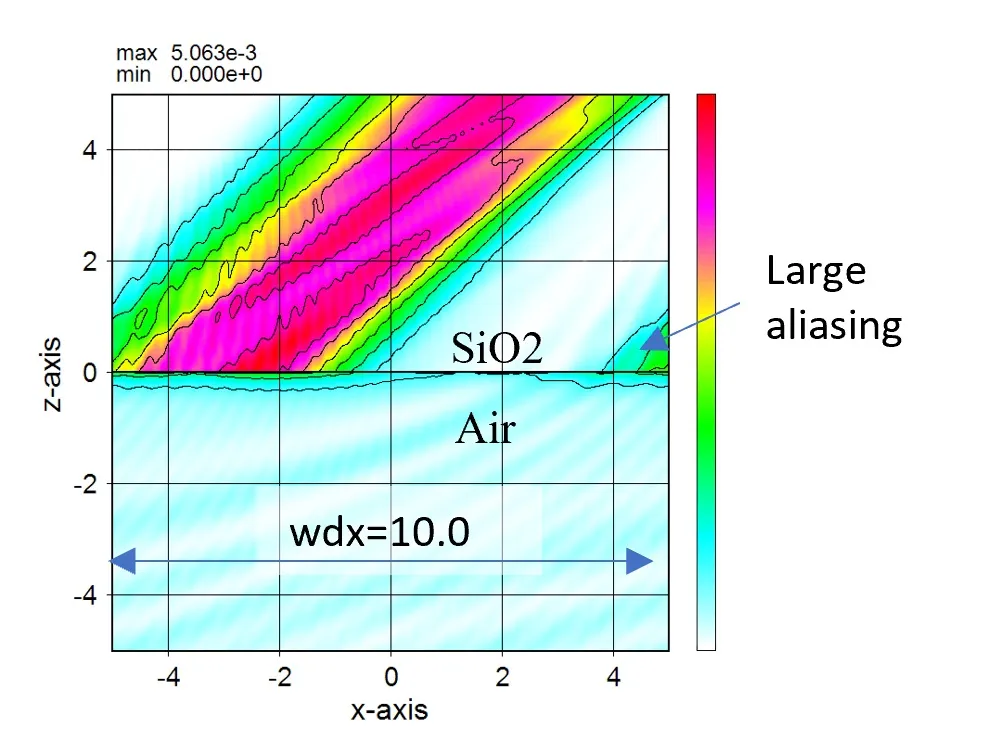
● In the case of an absorbing boundary condition (ABC).
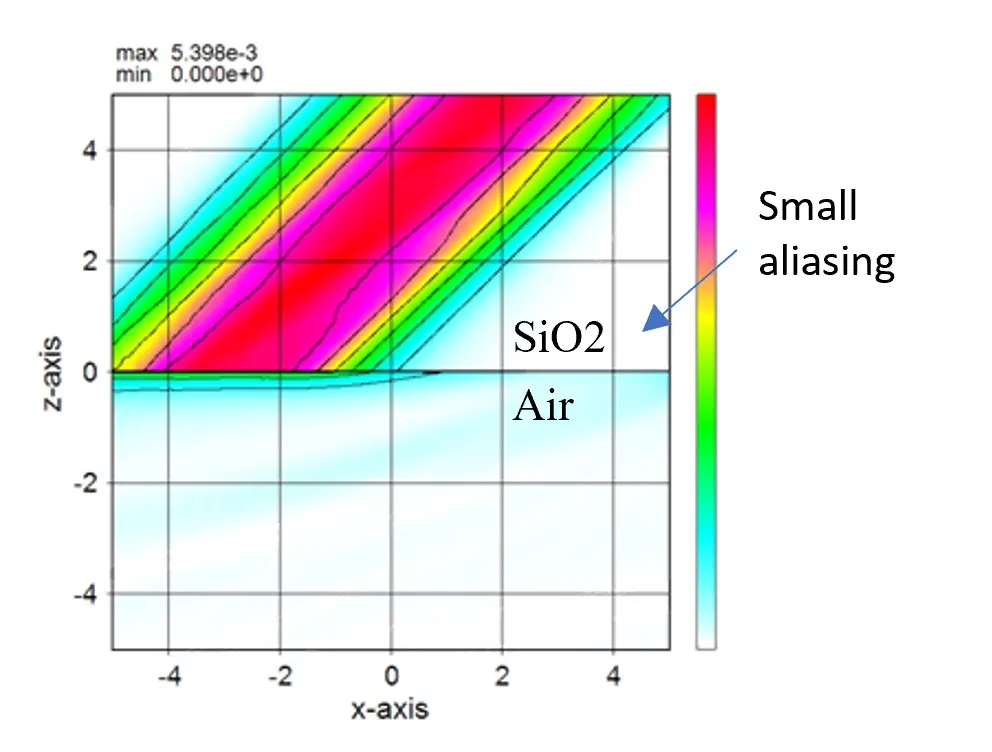
● Forward path (dislayed in 1st of Wscnt).
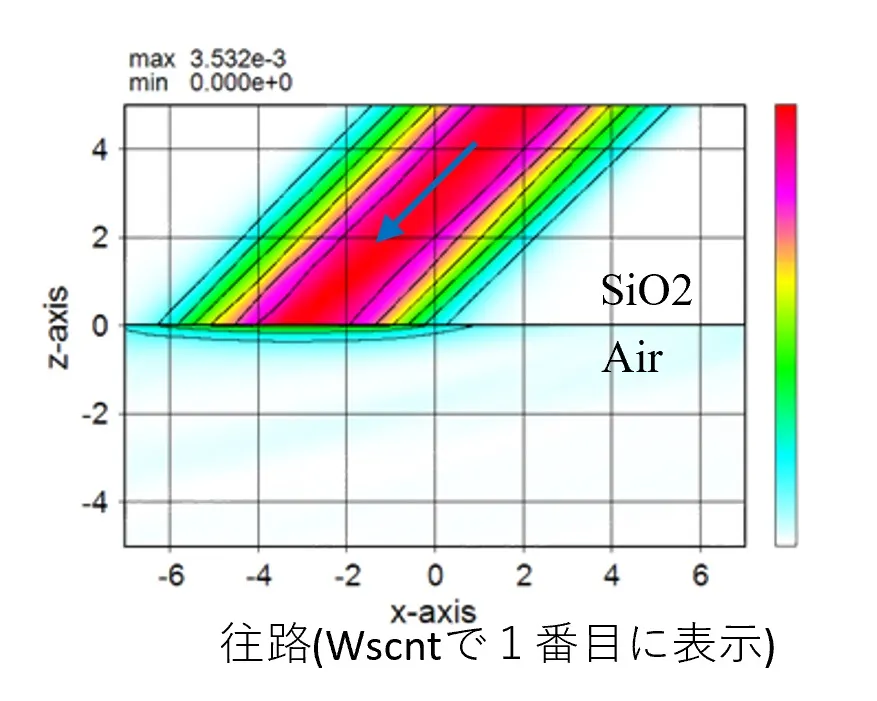
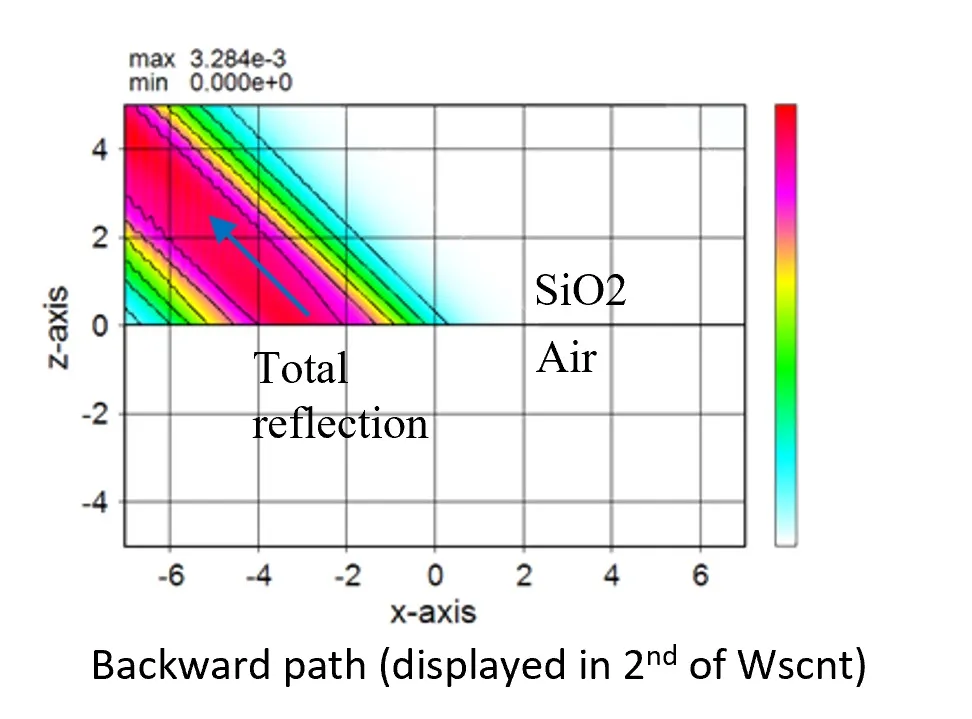
● Backward path (displayed in 2nd of Wscnt).
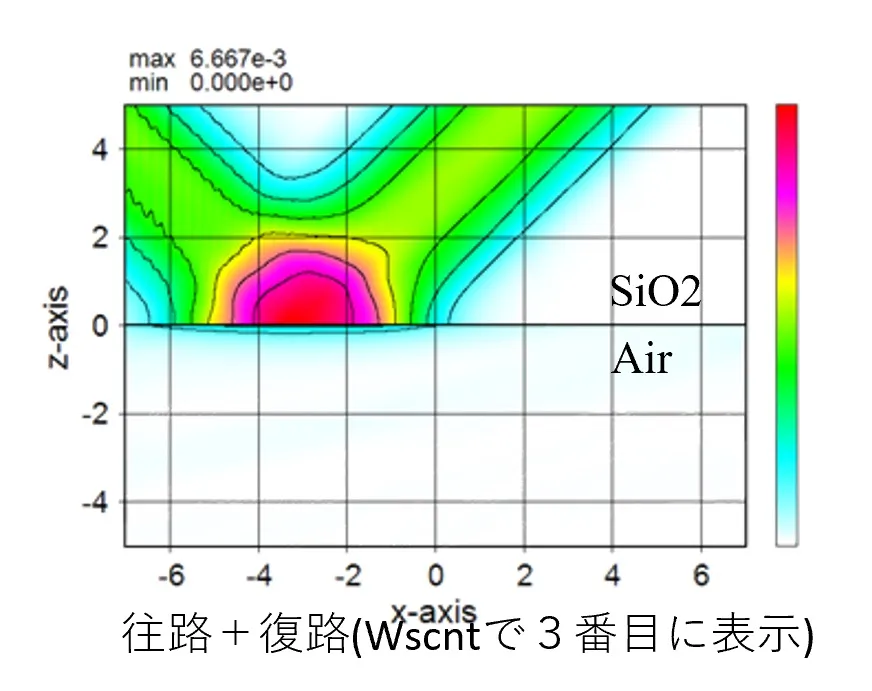
● Marge of forward and backward paths (displayed in 3rd of Wscnt).
● Light enters the refraction boundary at an angle.

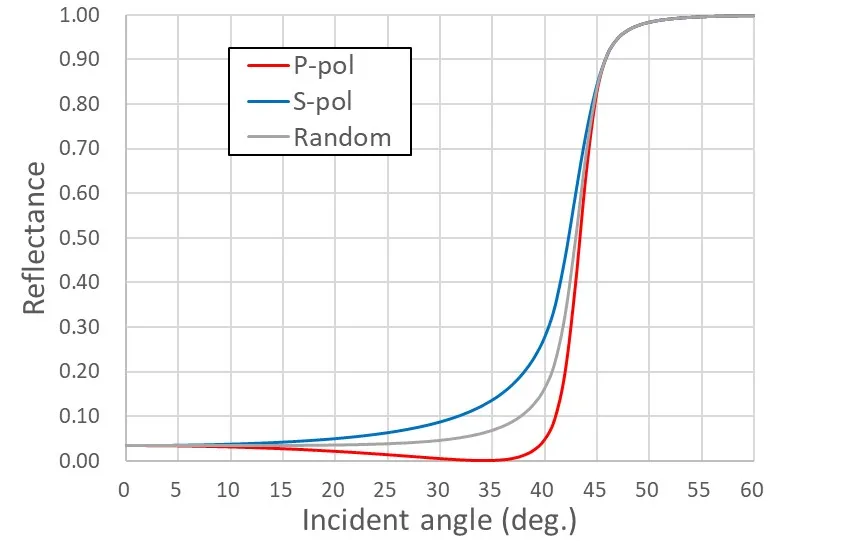
● Angular dependence of reflectance for polarization.
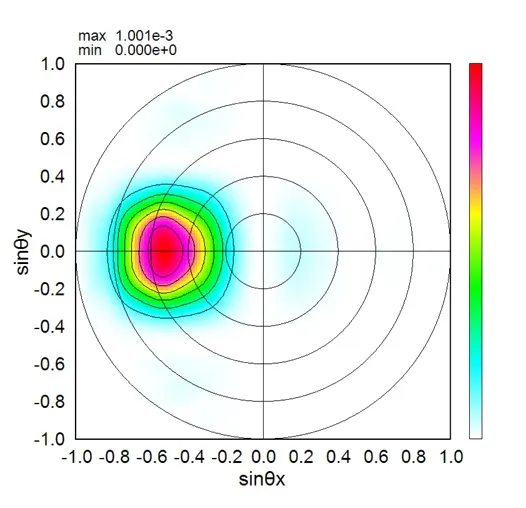
● Far field pattern in the lower side.
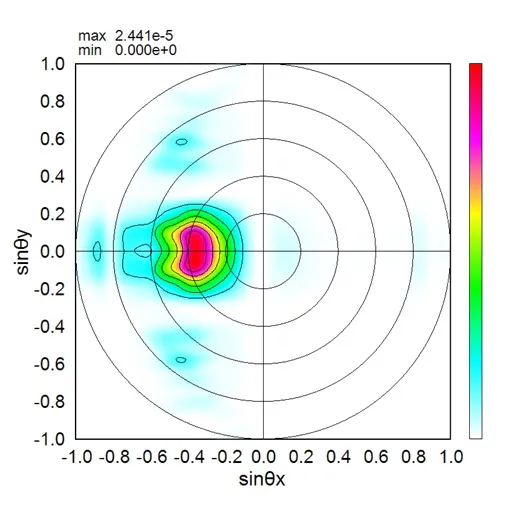
● Far field pattern in the upper side.
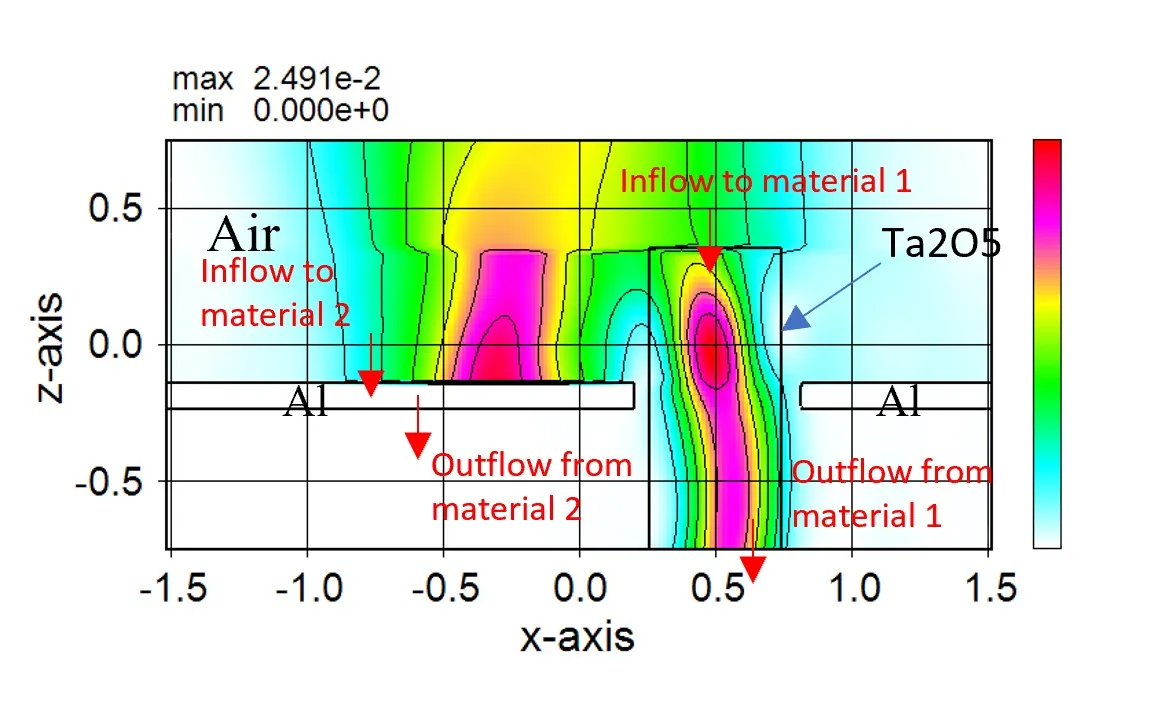
● Measurement result for each material region.

● In the case of external definition using sub.dat.
The isolated structure can be defined by the four points (x1,y1), (x2,y2), (x3,y3), and (x4,y4) described in sub.dat.
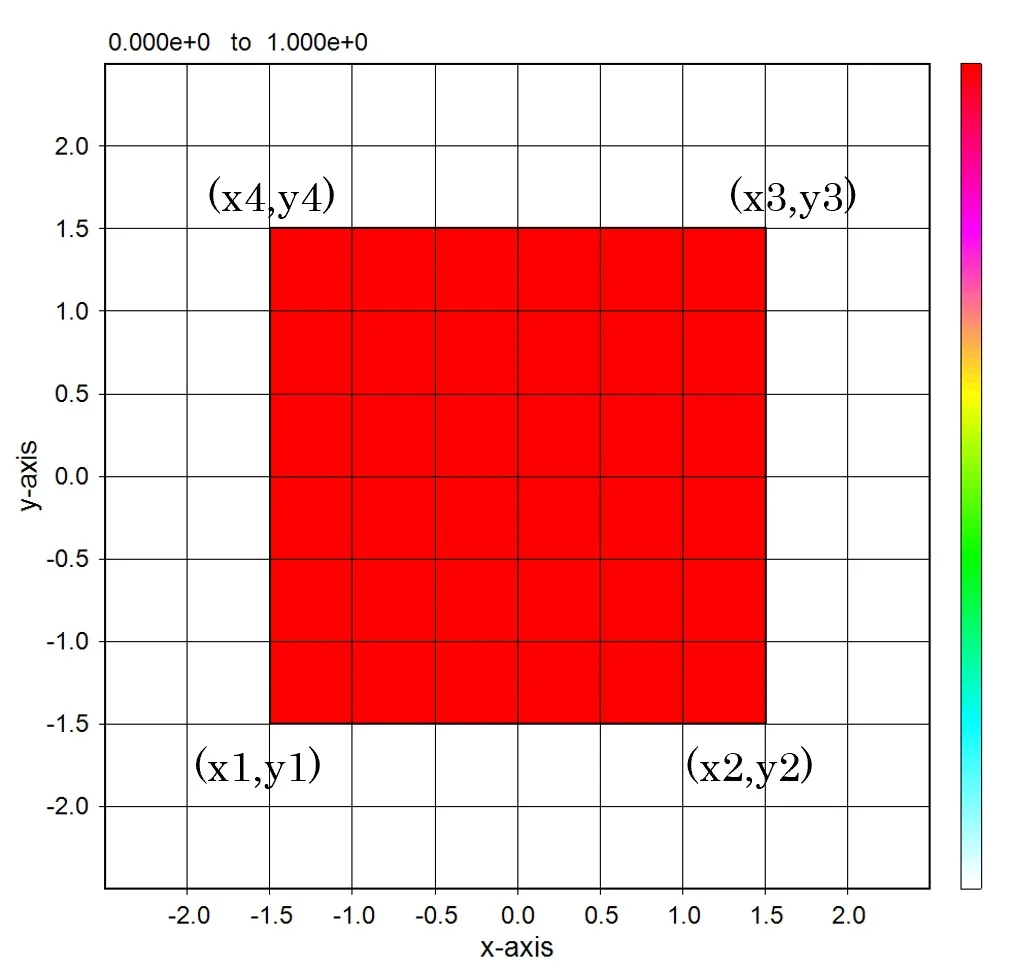
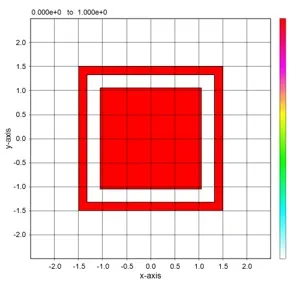
The structure defined by the piled data of four points. A periodic pattern for these structures can be defined easily.
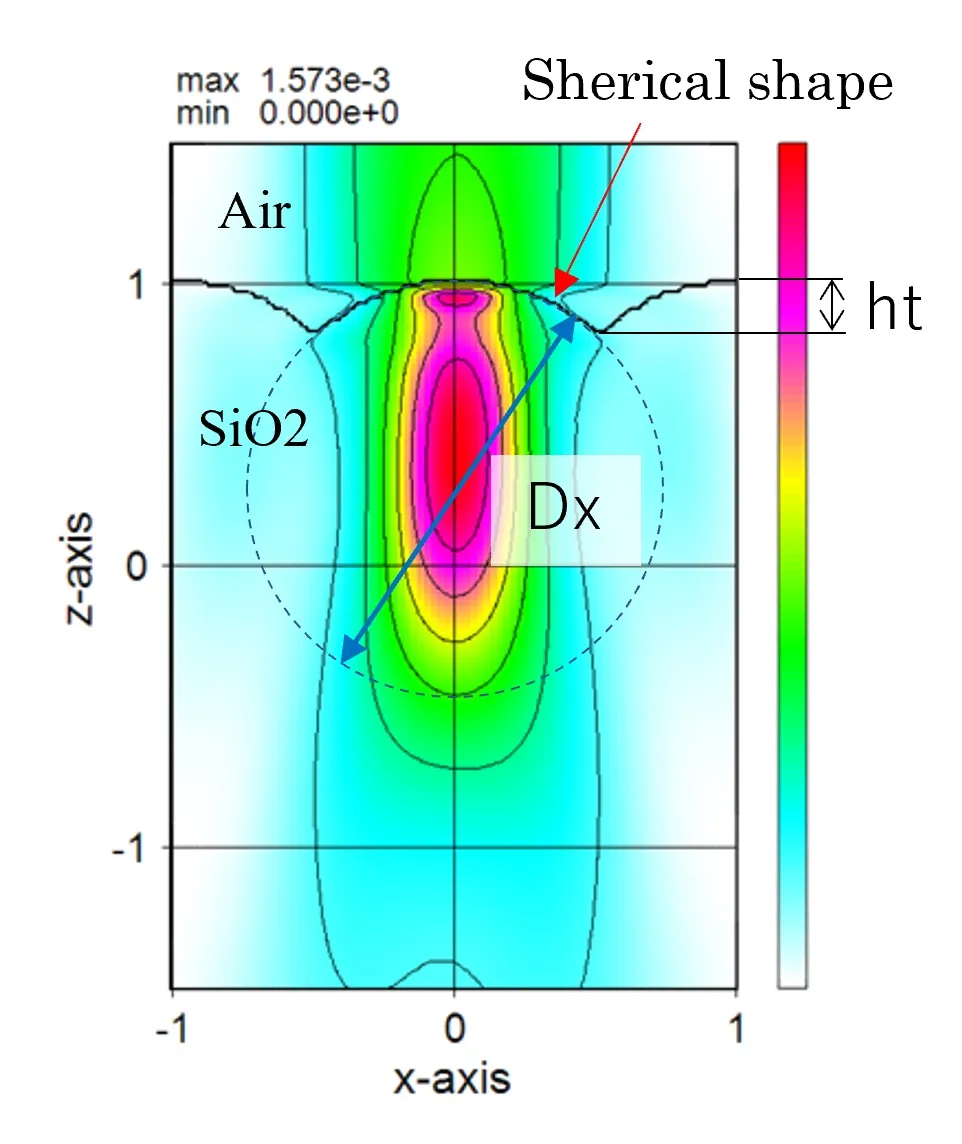
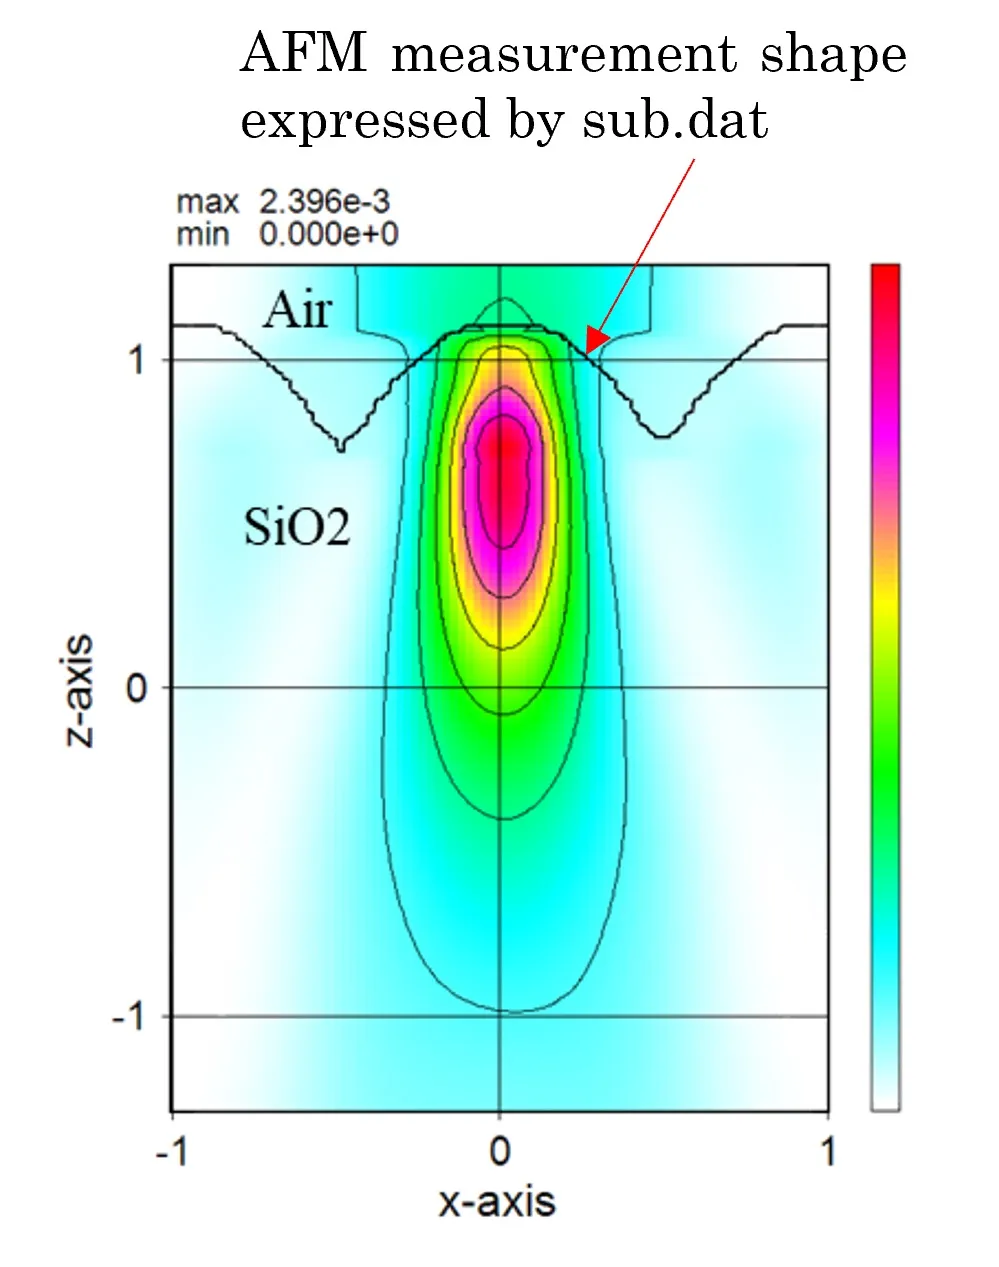
● The lens shape is expressed by stacking the externally defined circular structure.
● wsb.out Main calculation results.
● wsb1.out Extracted calculation results.
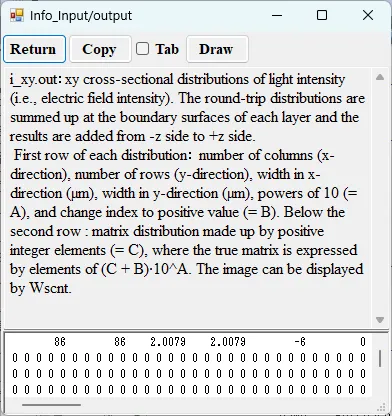
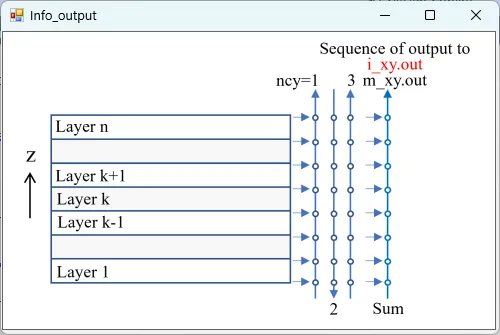
● i_xy.out xy cross-sectional distributions of light intensity.
drawing example.
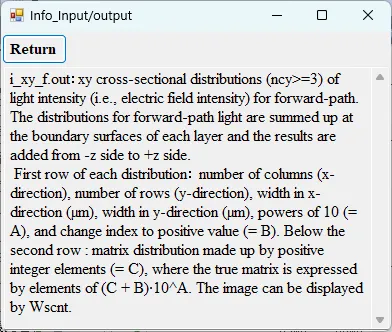
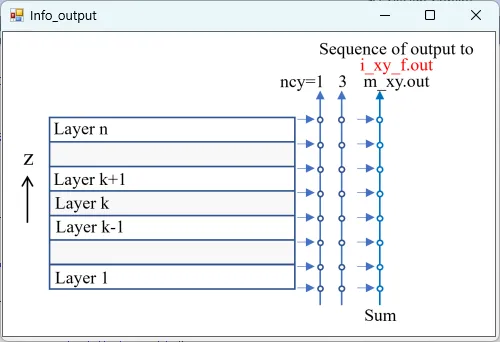
● i_xy_f.out xy cross-sectional distributions of total light intensity for forward path (ncy>=3).
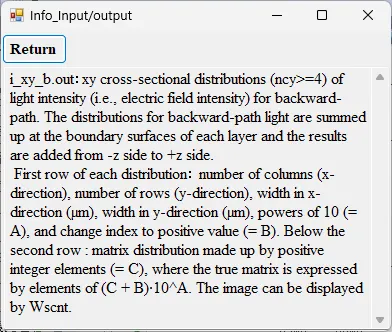
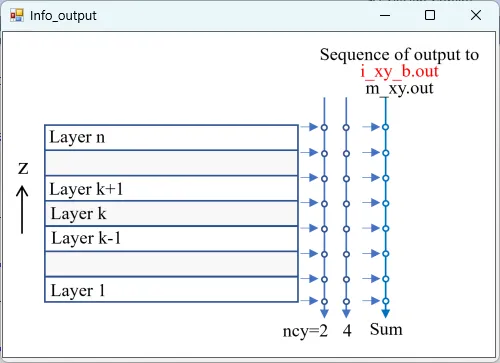
● i_xy_b.out xy cross-sectional distributions of total light intensity for backward path (ncy>=4).
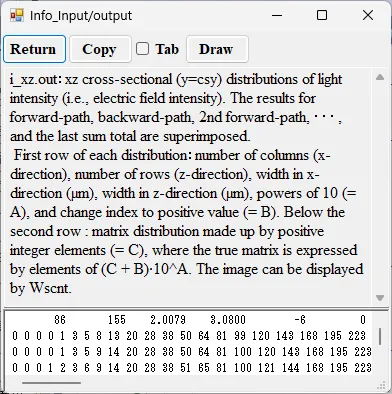
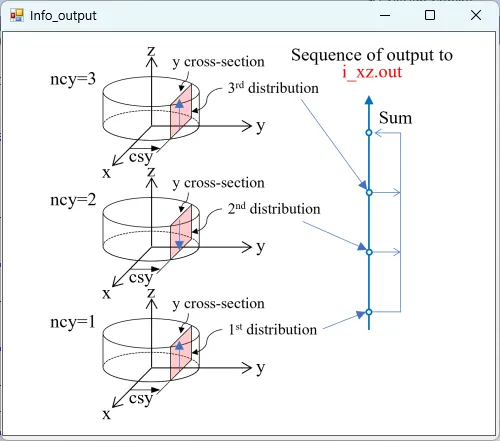
● i_xz.out xz cross-sectional (y=csy) distributions of light intensity.
drawing example.
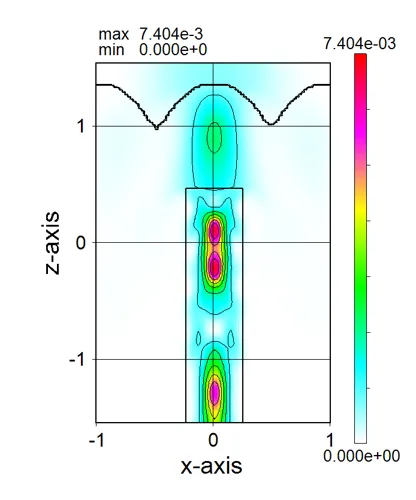
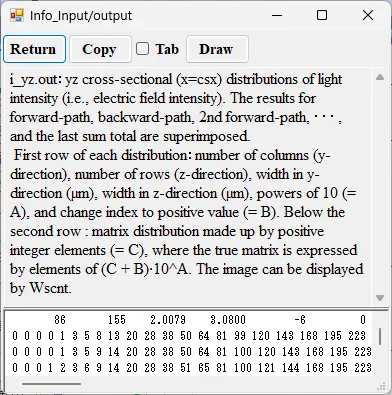
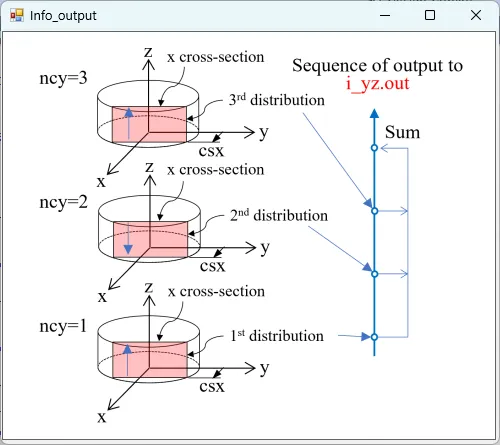
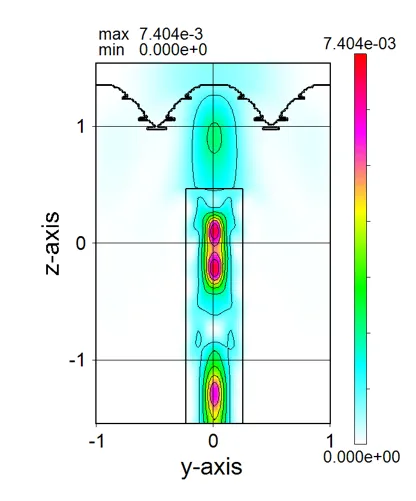
● i_yz.out yz cross-sectional (x=csx) distributions of light intensity.
drawing example.
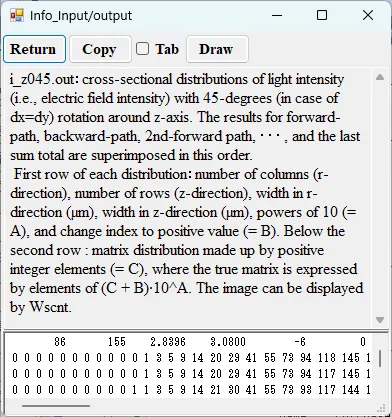
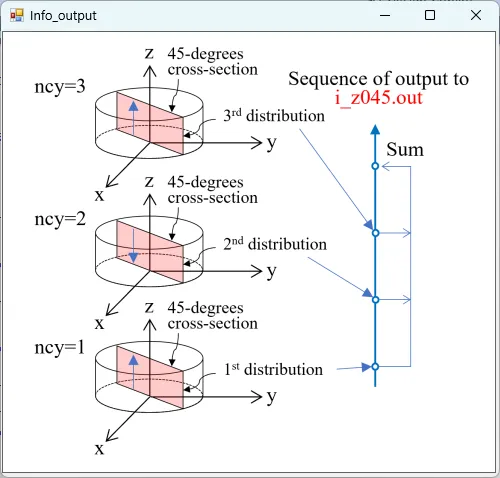
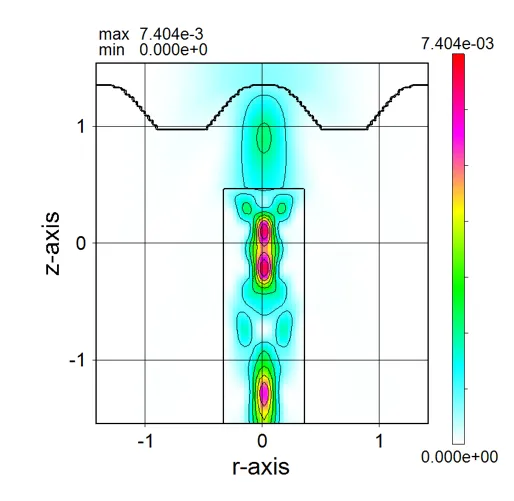
● i_z045.out Cross-sectional distribution with 45-degrees rotation around z-axis for light intensity.
drawing example.
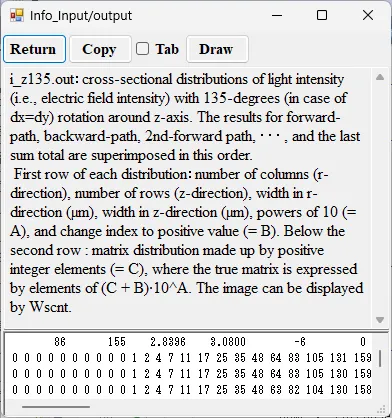
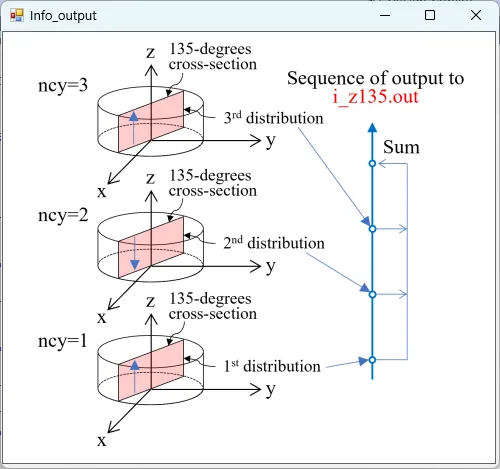
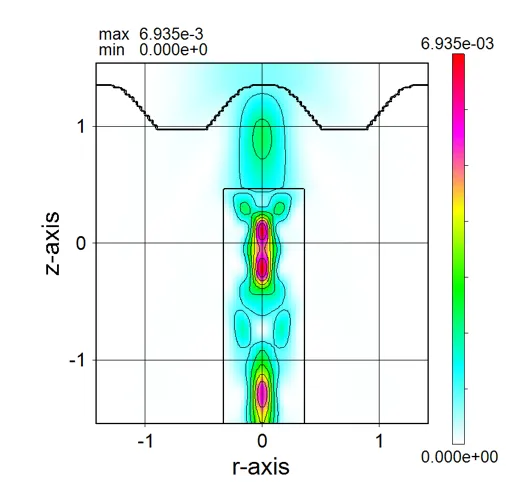
● i_z135.out Cross-sectional distribution with 135-degrees rotation around z-axis for light intensity.
drawing example.
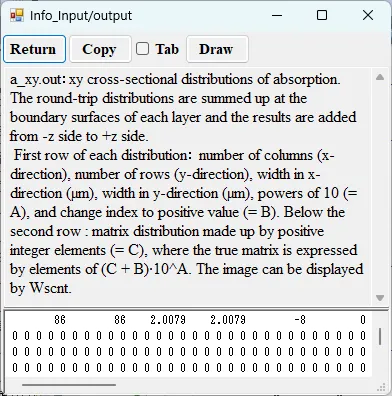
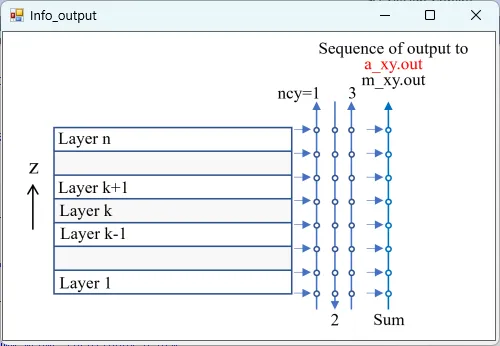
● a_xy.out xy cross-sectional distributions of absorption.
drawing example.
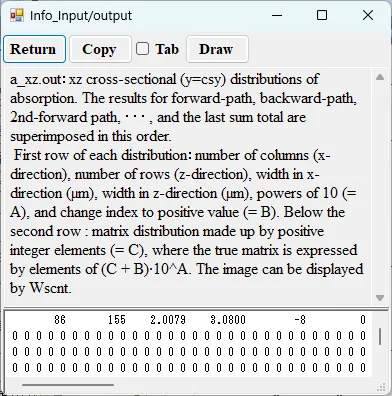
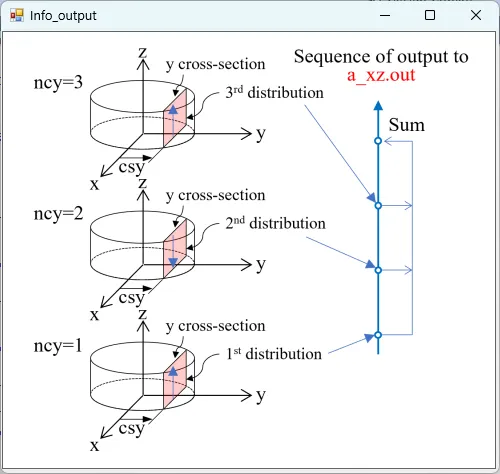
● a_xz.out xz cross-sectional (y=csy) distributions of absorption.
drawing example.
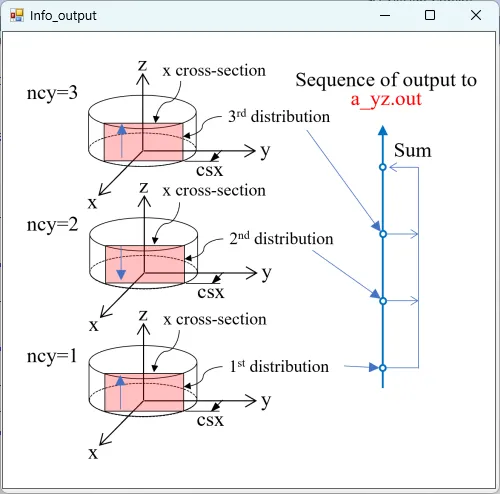
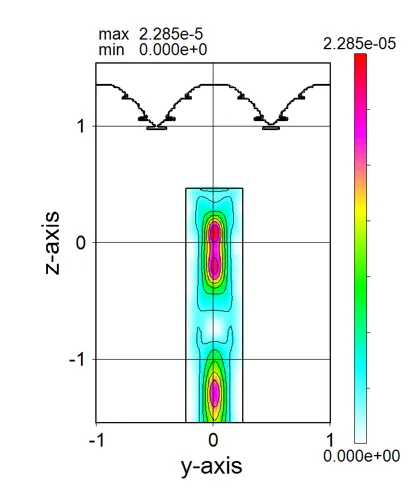
● a_yz.out yz cross-sectional (x=csx) distributions of absorption.
drawing example.
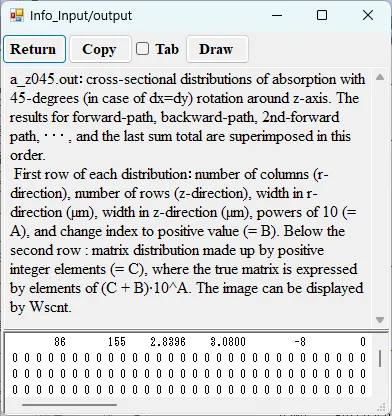
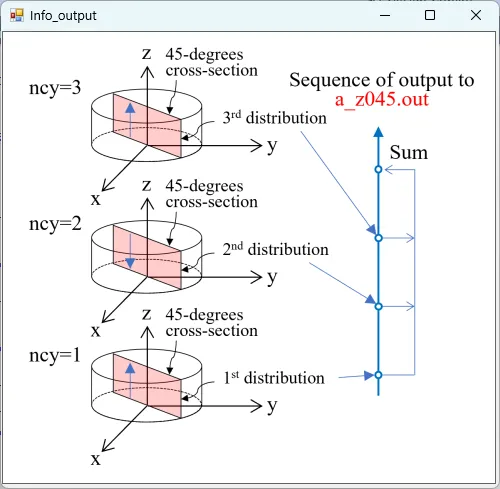
● a_z045.out Cross-sectional distribution with 45-degrees rotation around z-axis for absorption.
drawing example.
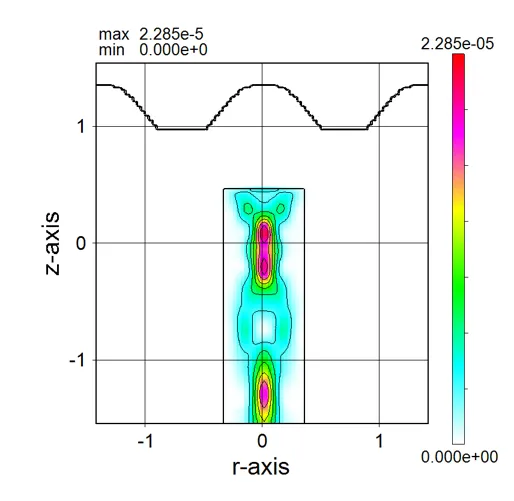
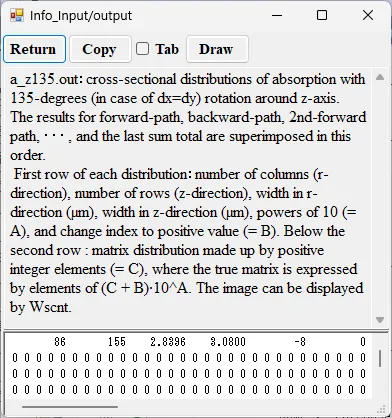
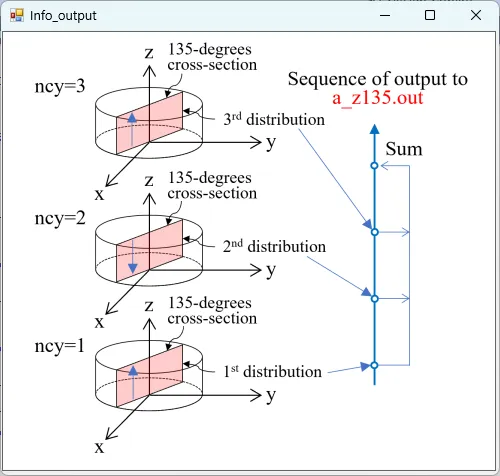
● a_z135.out Cross-sectional distribution with 135-degrees rotation around z-axis for absorption.
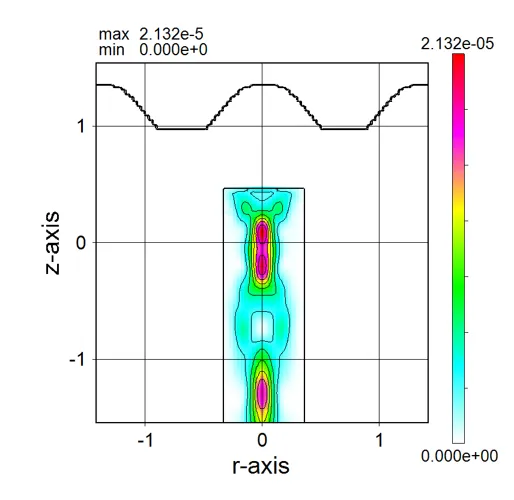
drawing example.
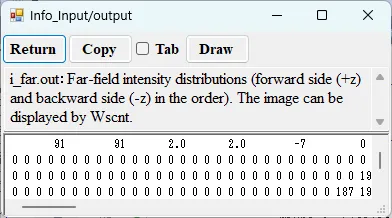
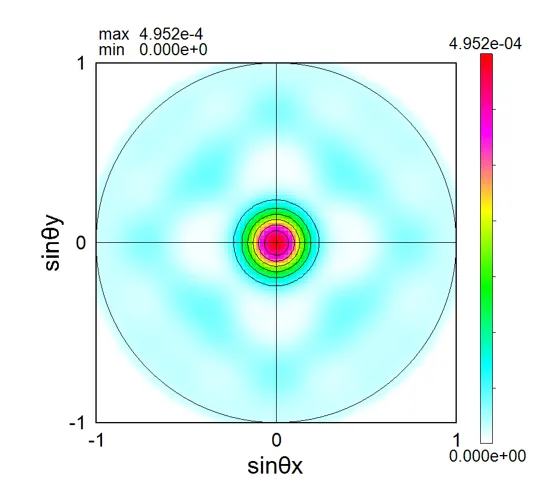
● i_far.out Far-field intensity distributions.
drawing example.
● 2. Types of boundary conditions, PBC and ABC
● 3. Calculation of transmitted light and reflected light
● 4. Fresnel's reflection, Snell's law and polarization calculation
● 5. Calculation for a far field in the lower and upper sides
● 6. Measurement of light amount
● 7. Cross-sections for various structures
● 8. Calculation for lens focusing
● 9. Visualizing the calculation results
● 10. Output files New 2024/11/12
1. Calculation principle and Babinet's principle ▲top
Wsb improves the calculation accuracy to the same level as FDTD, while maintaining the fast computing- performance of BPM. The calculation principle of wsb is based on the FFT-BPM (Beam Propagation Method) and it has a propagation process that applies the Babinet's principle as shown in (1) and (2) below.(1) Propagation in a homogeneous medium can be calculated by repeated FFT based on the Helmholtz’s equation (i.e., FFT-BPM), which is a rigorous wave equation in a homogeneous medium.


(2) Light distribution is divided into regions of different refractive index media at refractive surfaces, and propagation is calculated for each forward and return path. Based on differences in characteristics in a frequency space, light incident on the refractive surfaces is classified into four types: transmitted light and evanescent light on the forward path, Fresnel reflection light and total reflection light on the return path, and each is combined to express the accurate propagation based on the Babinet's principle, where evanescent light is a decay component radiating total reflection light. Since Fresnel reflection is considered at the refractive surfaces, polarization can be handled. The process of synthesizing light distributions passing through complementary regions is the same as the Babinet‘s principle and it is a calculation method in which the energy change under the operation is very small (that is, energy conservation is nearly satisfied).

(3) The calculation formulas for each light distribution in the above figure are shown below.

(Reference) Babinet's principle
For diffraction due to complementary screens A' and A", the relationship of uA'+uA"=uA holds where complexed amplitudes of diffractive light are uA' and uA".

2. Types of boundary conditions, PBC and ABC ▲top
● In the case of a periodic boundary condition (PBC).
● In the case of an absorbing boundary condition (ABC).

3. Calculation of transmitted light and reflected light ▲top
Transmitted light and reflected light (forward light and backward light) are calculated separately and merged.● Forward path (dislayed in 1st of Wscnt).

● Backward path (displayed in 2nd of Wscnt).

● Marge of forward and backward paths (displayed in 3rd of Wscnt).

4. Fresnel's reflection, Snell's law and polarization calculation ▲top
There are methods for BPM, such as FFT-BPM, which is a scalar calculation, and FD-BPM, which is a vector calculation. FD-BPM can handle the problem of polarization, but it does not satisfy Snell's law because it approximates the Fresnel approximation of the wave equation (omitting the partial derivative of the second order). FFT-BPM is based on equation (a), so there is no omission of the second-order partial derivative term, but it does not satisfy Snell's law because the refractive index distribution is regarded as the difference from the standard refractive index and the complex propagation constant is expressed in terms of this standard refractive index. In contrast, Wsb expresses the complex propagation constant in terms of the refractive index of each region (i.e., the process of Babinet's principle described above) and solves equations (b) to (f) on the basis of equation (a), so that Snell's law is accurately expressed. Furthermore, by considering equation (c), polarisation at the refractive boundary can be handled as shown below.● Light enters the refraction boundary at an angle.

● Angular dependence of reflectance for polarization.

5. Calculation for a far field in the lower and upper sides ▲top
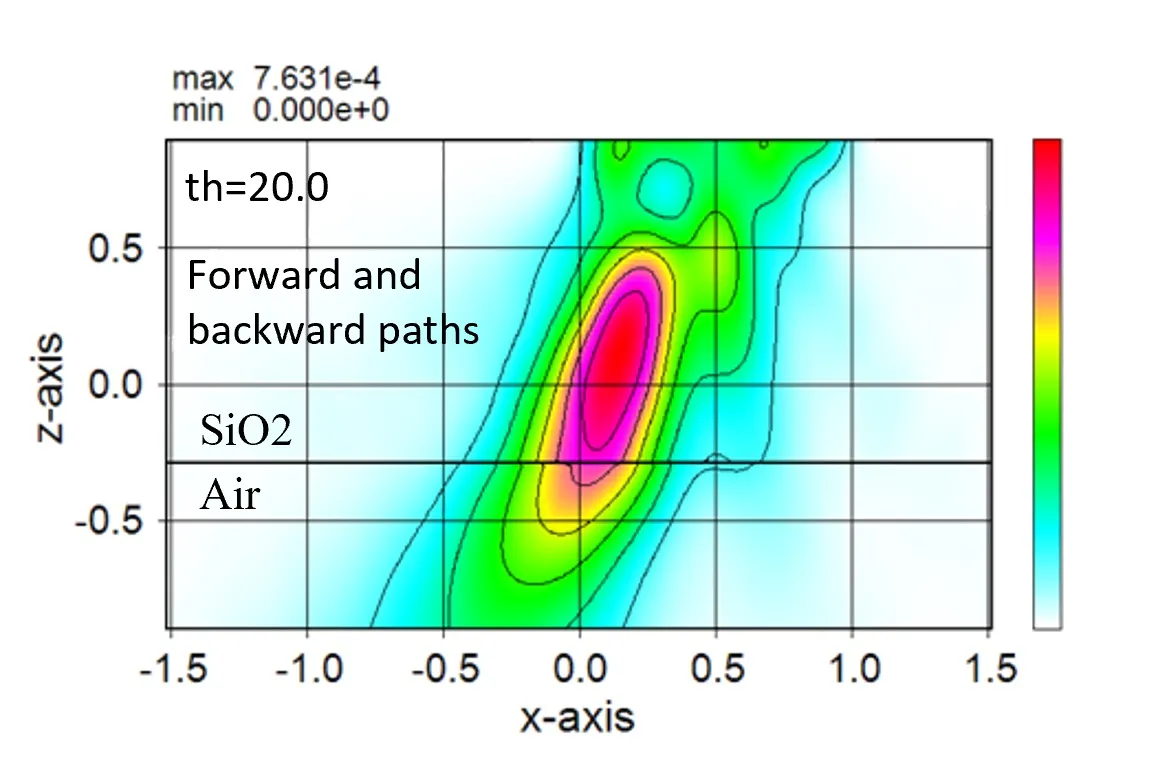
● Inclined light propagates from the top surface to the bottom surface.
● Far field pattern in the lower side.

● Far field pattern in the upper side.

6. Measurement of light amount ▲top
● The amount of light input and output and the amount of light absorbed can be measured individually for each material or area.
● Measurement result for each material region.
7. Cross-sections for various structures ▲top
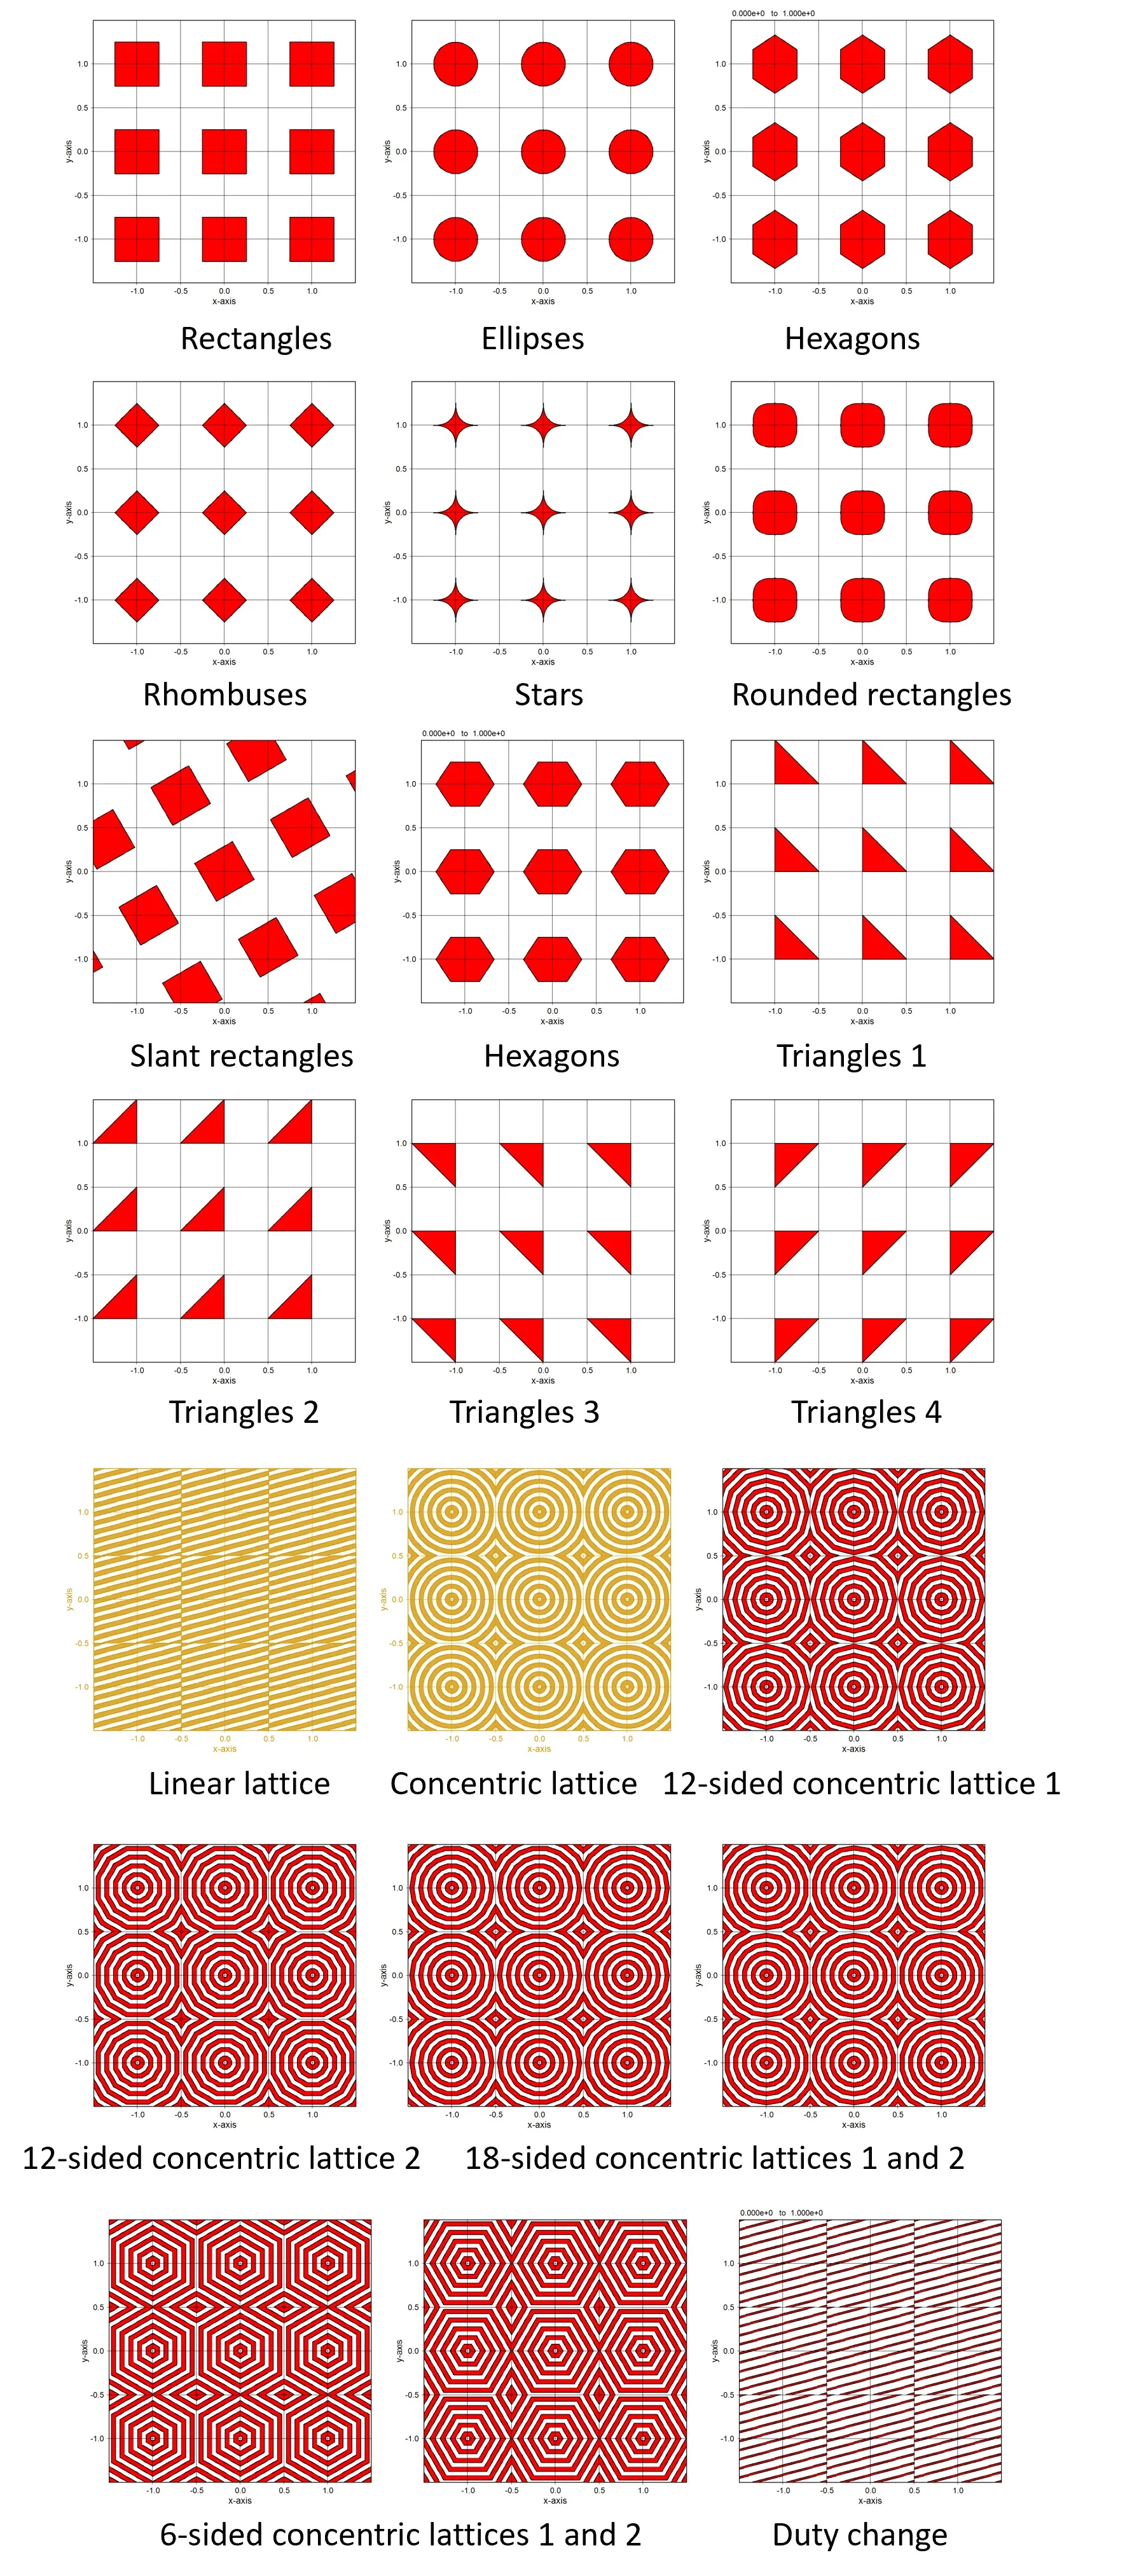
● In the case of internal definition.
● In the case of external definition using sub.dat.
The isolated structure can be defined by the four points (x1,y1), (x2,y2), (x3,y3), and (x4,y4) described in sub.dat.

The structure defined by the piled data of four points. A periodic pattern for these structures can be defined easily.

8. Calculation for lens focusing ▲top
● The lens shape is expressed by stacking the internally defined circular structure.
● The lens shape is expressed by stacking the externally defined circular structure.

9. Visualizing the calculation results ▲top
● At runtime, the calculation results are displayed in real time by Wscnt.
10. Output files ▲top
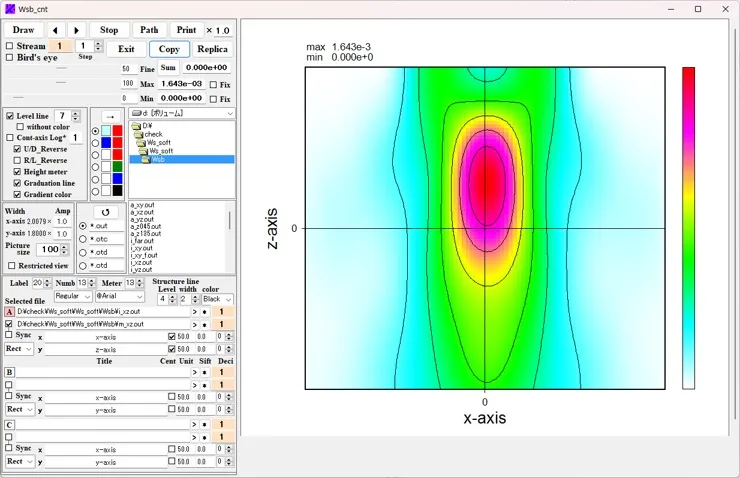
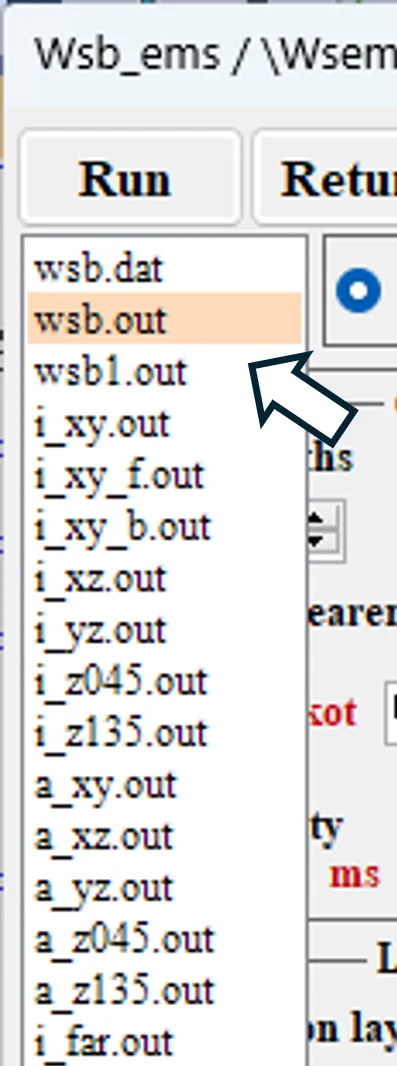
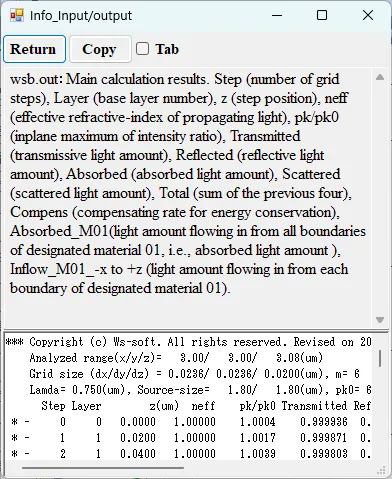
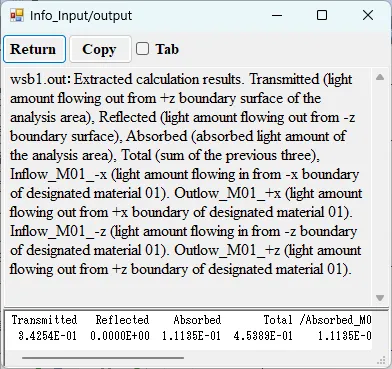
The contents of each output file are described based on the contents displayed by double-clicking the item in the Result file box on the Source setting window.
● wsb.out Main calculation results.

● wsb1.out Extracted calculation results.

● i_xy.out xy cross-sectional distributions of light intensity.


drawing example.
● i_xy_f.out xy cross-sectional distributions of total light intensity for forward path (ncy>=3).


● i_xy_b.out xy cross-sectional distributions of total light intensity for backward path (ncy>=4).


● i_xz.out xz cross-sectional (y=csy) distributions of light intensity.


drawing example.

● i_yz.out yz cross-sectional (x=csx) distributions of light intensity.


drawing example.

● i_z045.out Cross-sectional distribution with 45-degrees rotation around z-axis for light intensity.


drawing example.

● i_z135.out Cross-sectional distribution with 135-degrees rotation around z-axis for light intensity.


drawing example.

● a_xy.out xy cross-sectional distributions of absorption.


drawing example.
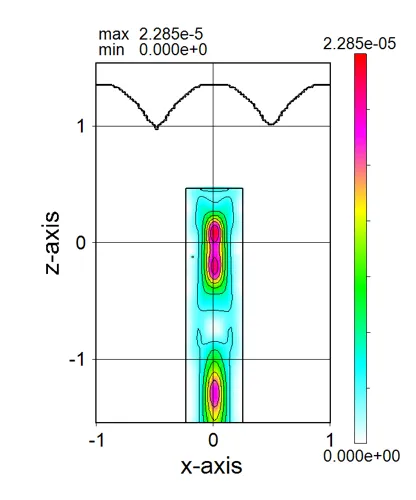
● a_xz.out xz cross-sectional (y=csy) distributions of absorption.


drawing example.

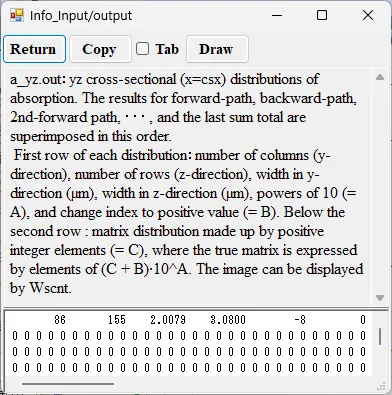
● a_yz.out yz cross-sectional (x=csx) distributions of absorption.


drawing example.

● a_z045.out Cross-sectional distribution with 45-degrees rotation around z-axis for absorption.


drawing example.

● a_z135.out Cross-sectional distribution with 135-degrees rotation around z-axis for absorption.


drawing example.

● i_far.out Far-field intensity distributions.

drawing example.
