Contour plot software : Wscnt
To Japanese
● 1. Specifying a drawing file and setting axis conditions
● 2. Displaying a contour Image
● 3. How to edit contour data
● 4. Editing Existing Drawing Data
● 5. Bird's eye view
● 6. Viewing the contents of data
● 7. Stretching an image
● 8. Axis inverting of images
● 9. Showing only contour lines
● 10. Choosing a pixel drawing method
● 11. Bird's eye view
● 12. Calculation of the sum value, cuting and pasting images
● 13. Displaying serial images
● 14. Displaying circular coordinates, stretching the operation panel
● 15. Useful shortcuts
Let's render the output results of Wsf, Wsr, and Wsb as contour plots and bird's eye views. Normally, it is automatically set by Wsems and contour lines are drawn, but here we will explain how to operate it manually.
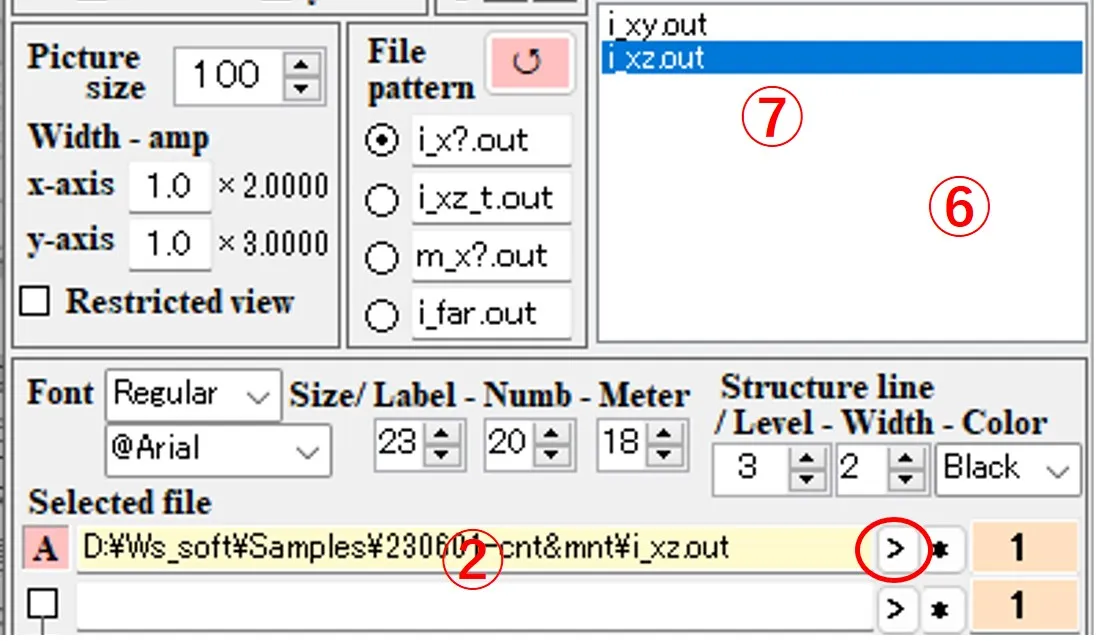
(2) When the file ⑦ is selected from the file list ⑥, the path and the file name are described in box ②. If the path name is long and sticks out of the box, you can slide it with the click of the > button.
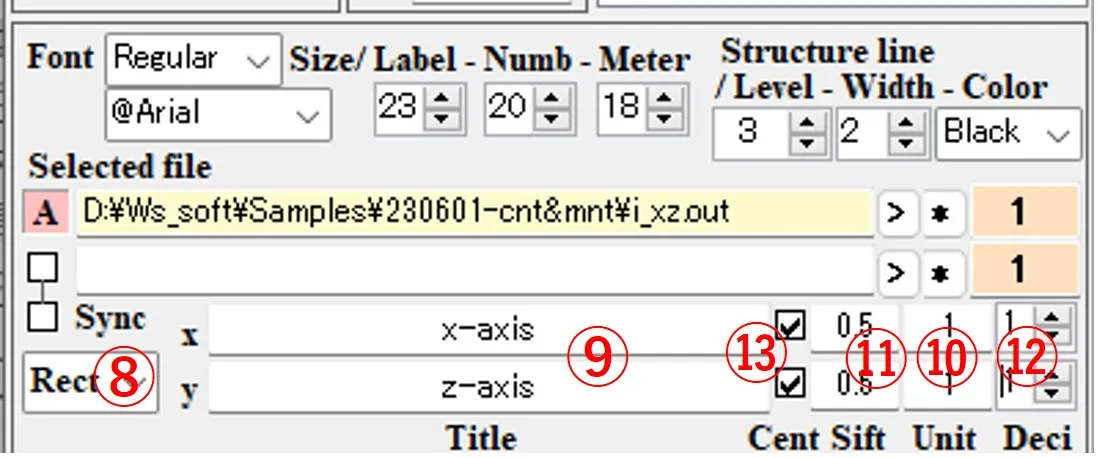
(3) In box ⑧, select "Rect" (square coordinates) as the axis type. Enter the title of the axis in boxes ⑨, the axis unit in boxes ⑩, the axis shift width in boxes ⑪, and the number of decimal places in the axis unit in boxes ⑫. The box ⑬ changes to a black check-mark by click and a gray check-mark by right-click. If there is no check, the origin of the axis value is at the lower (left) axis intersection. If black-checked, the origin is at the center of the axis. If it gray-checked, the origin is at the upper (right) axis intersection.
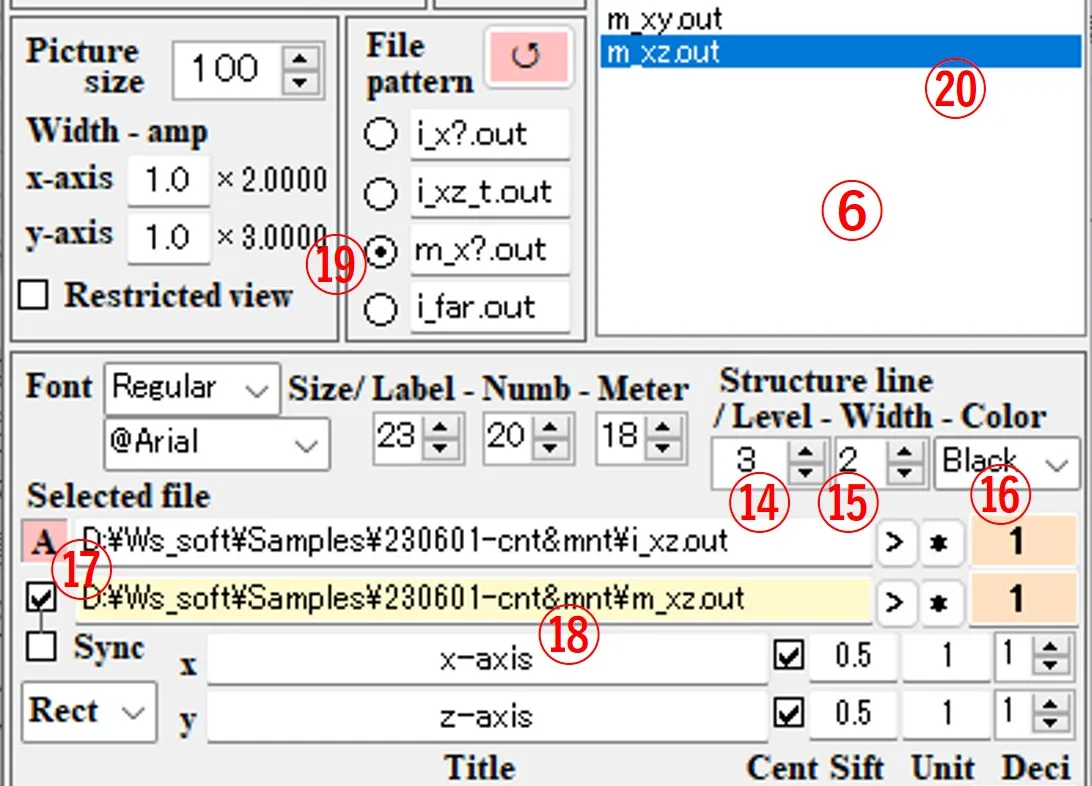
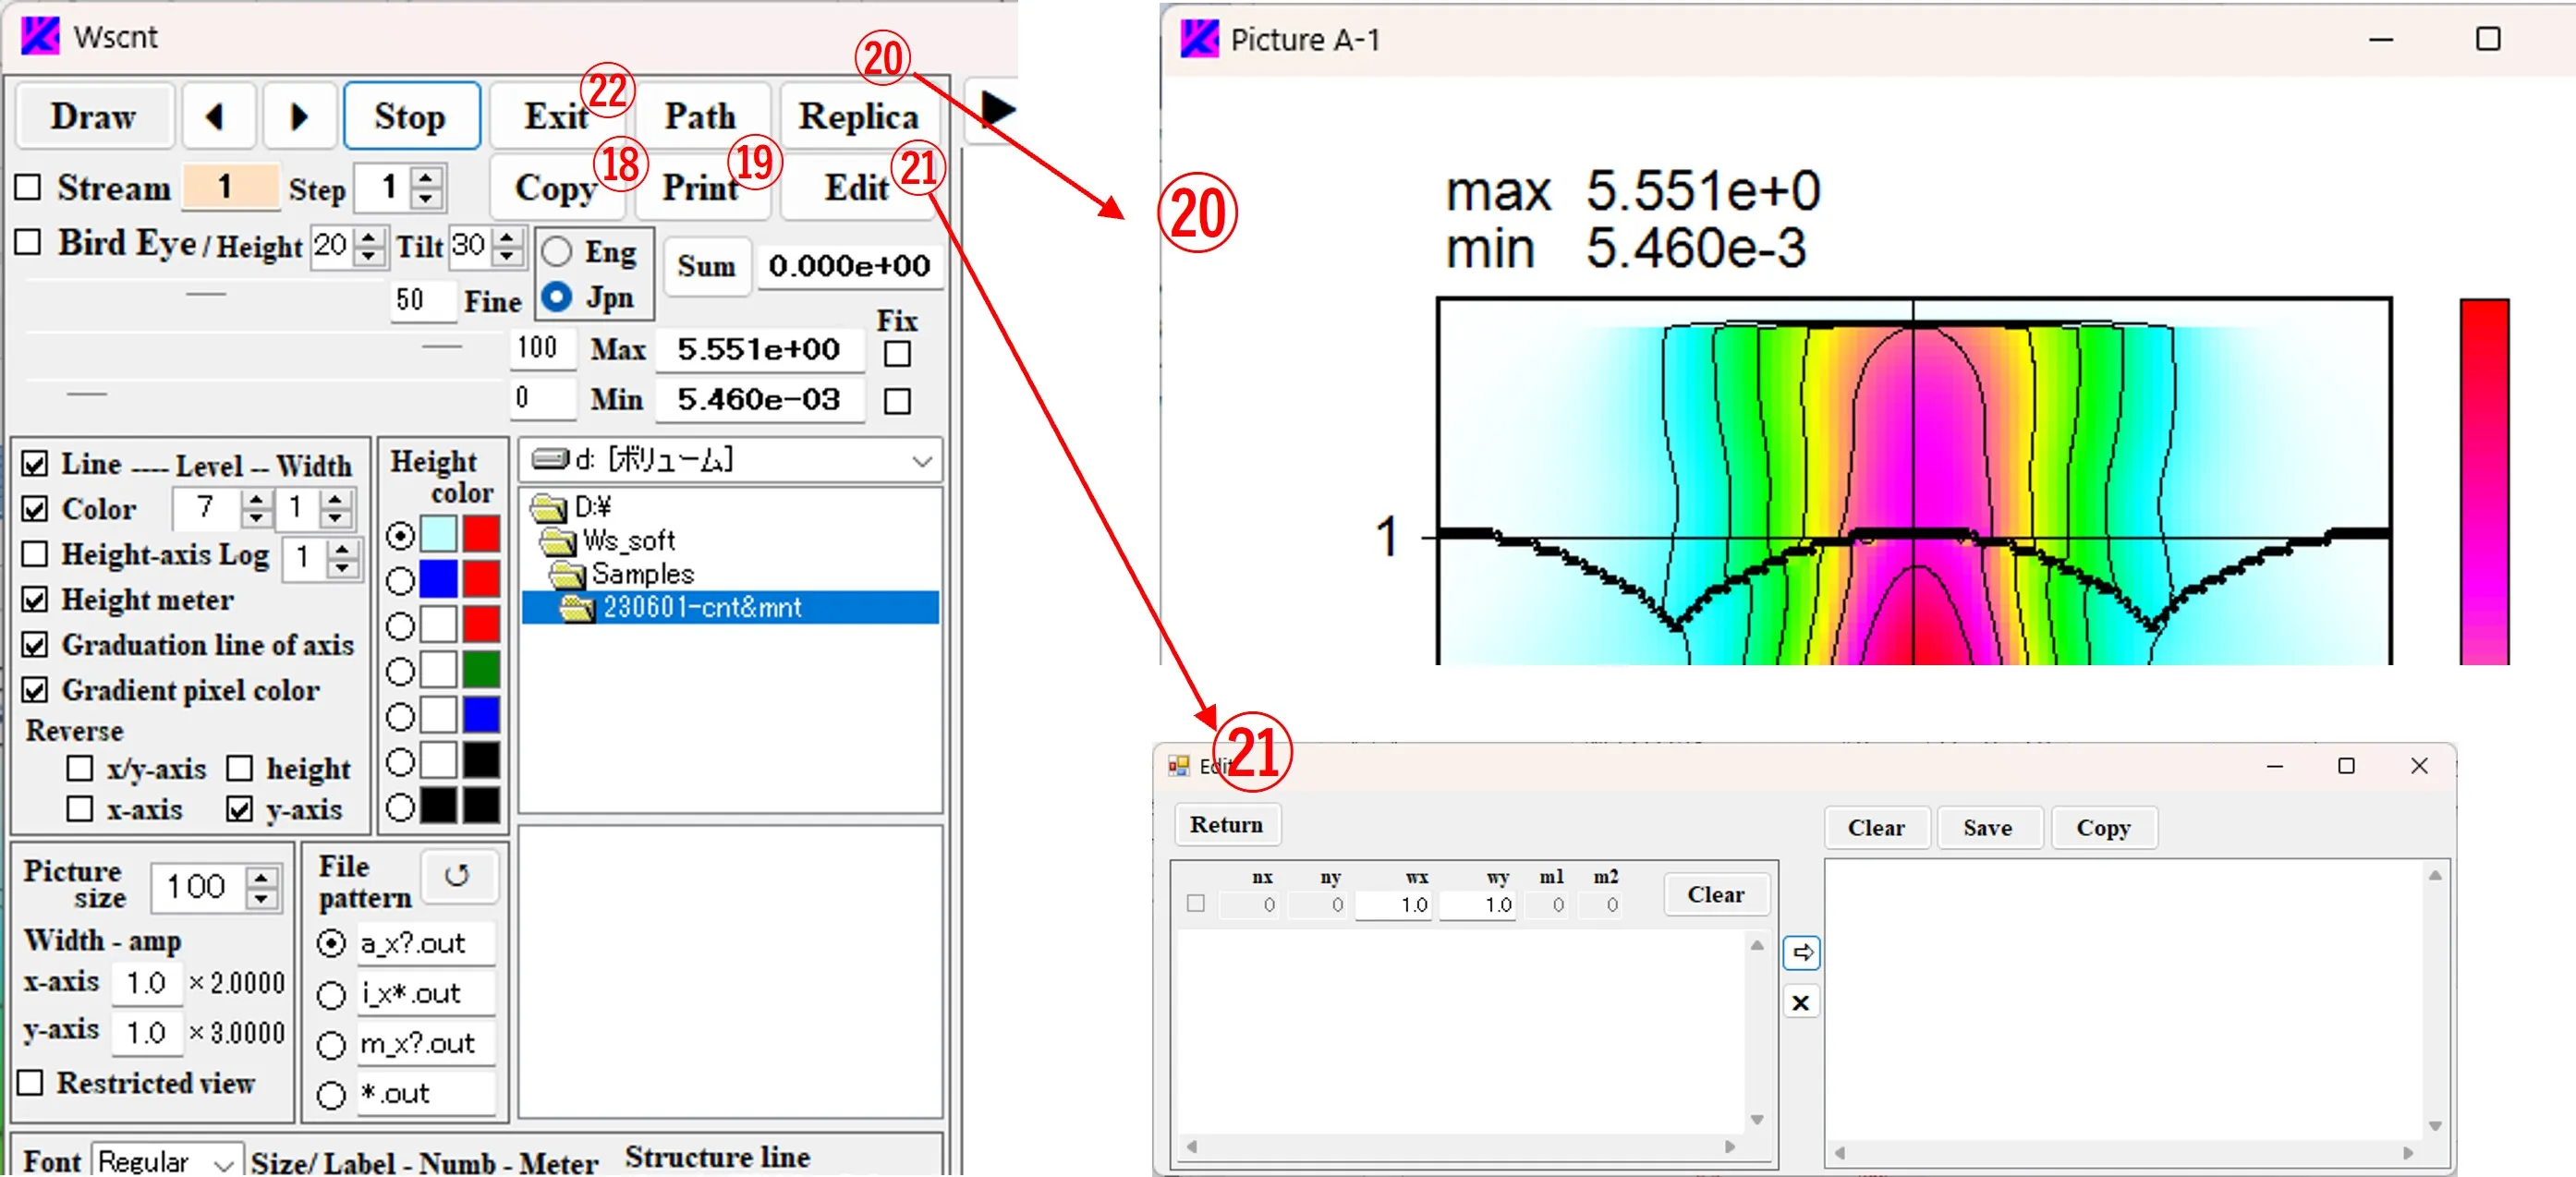
(4) To add a structural border, select the number of division levels, line width, and line color in the boxes of ⑭, ⑮, and ⑯, check box ⑰, click box ⑱ to change the background color to yellow. By selecting the file pattern ⑲ and selecting the file ⑳ from the file list ⑥, the path and file name are described in the box ⑱. The number of division levels in the box ⑭ is set to the number of materials used in the optical calculation + 1.
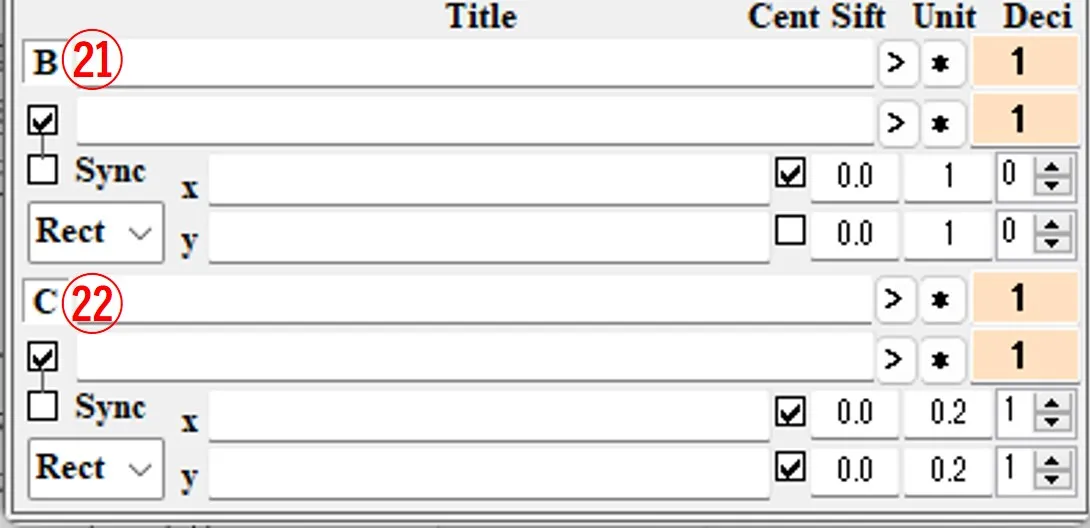
(5) The operation of buttons B ㉑ and C ㉒ is the same, and data of the button with a pink background color is the target of drawing.
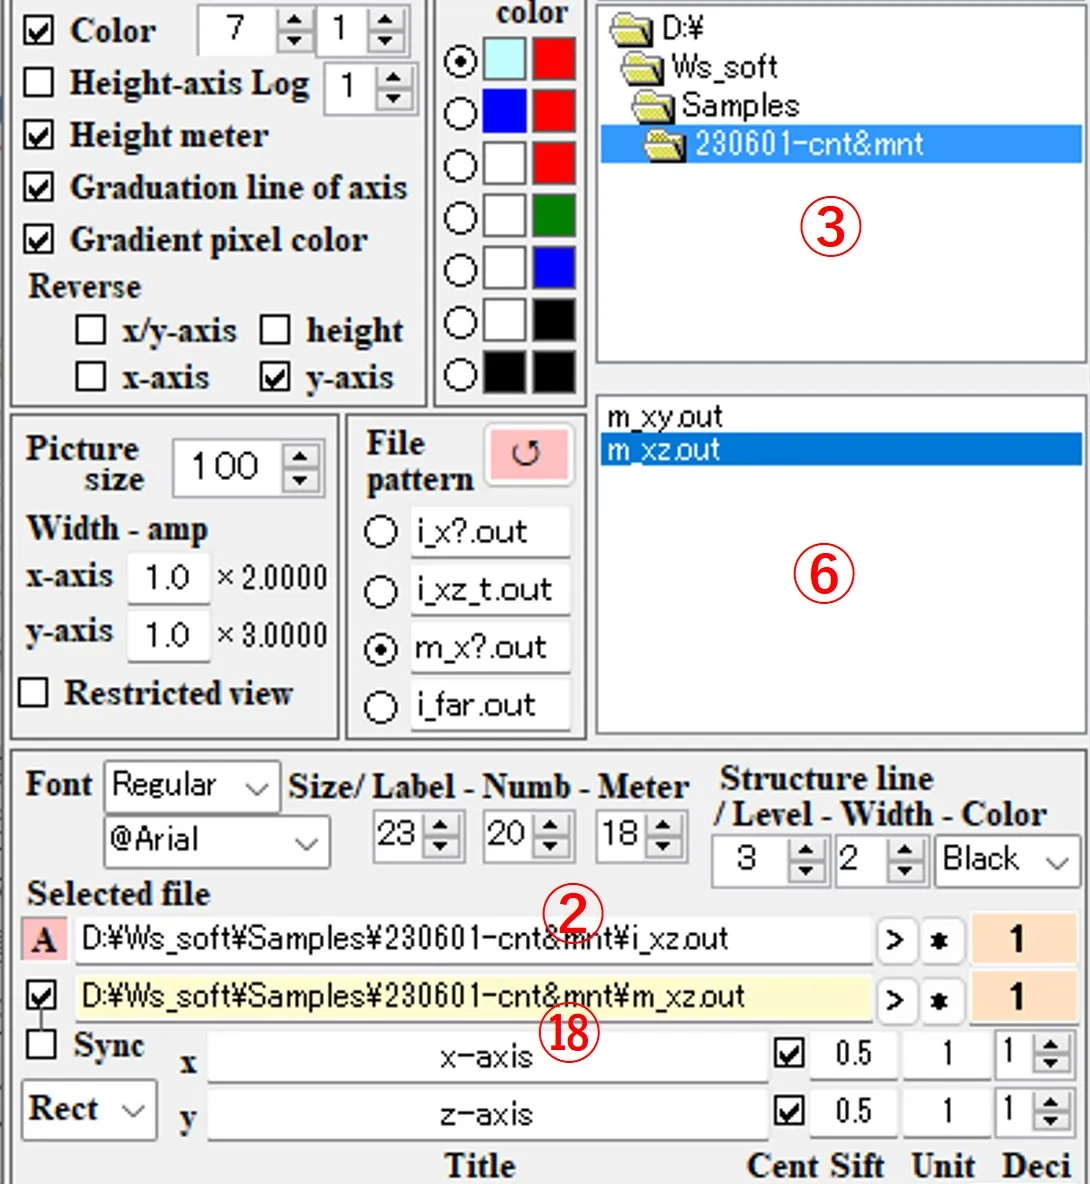
(6) If you right-click boxes ② and ⑱, boxes ③ and ⑥ are aligned in the path of the described file. Double-click boxes ② and ⑱ to erase the description and to change the background color to yellow. A box with a yellow background is used to enter the path and the file name.
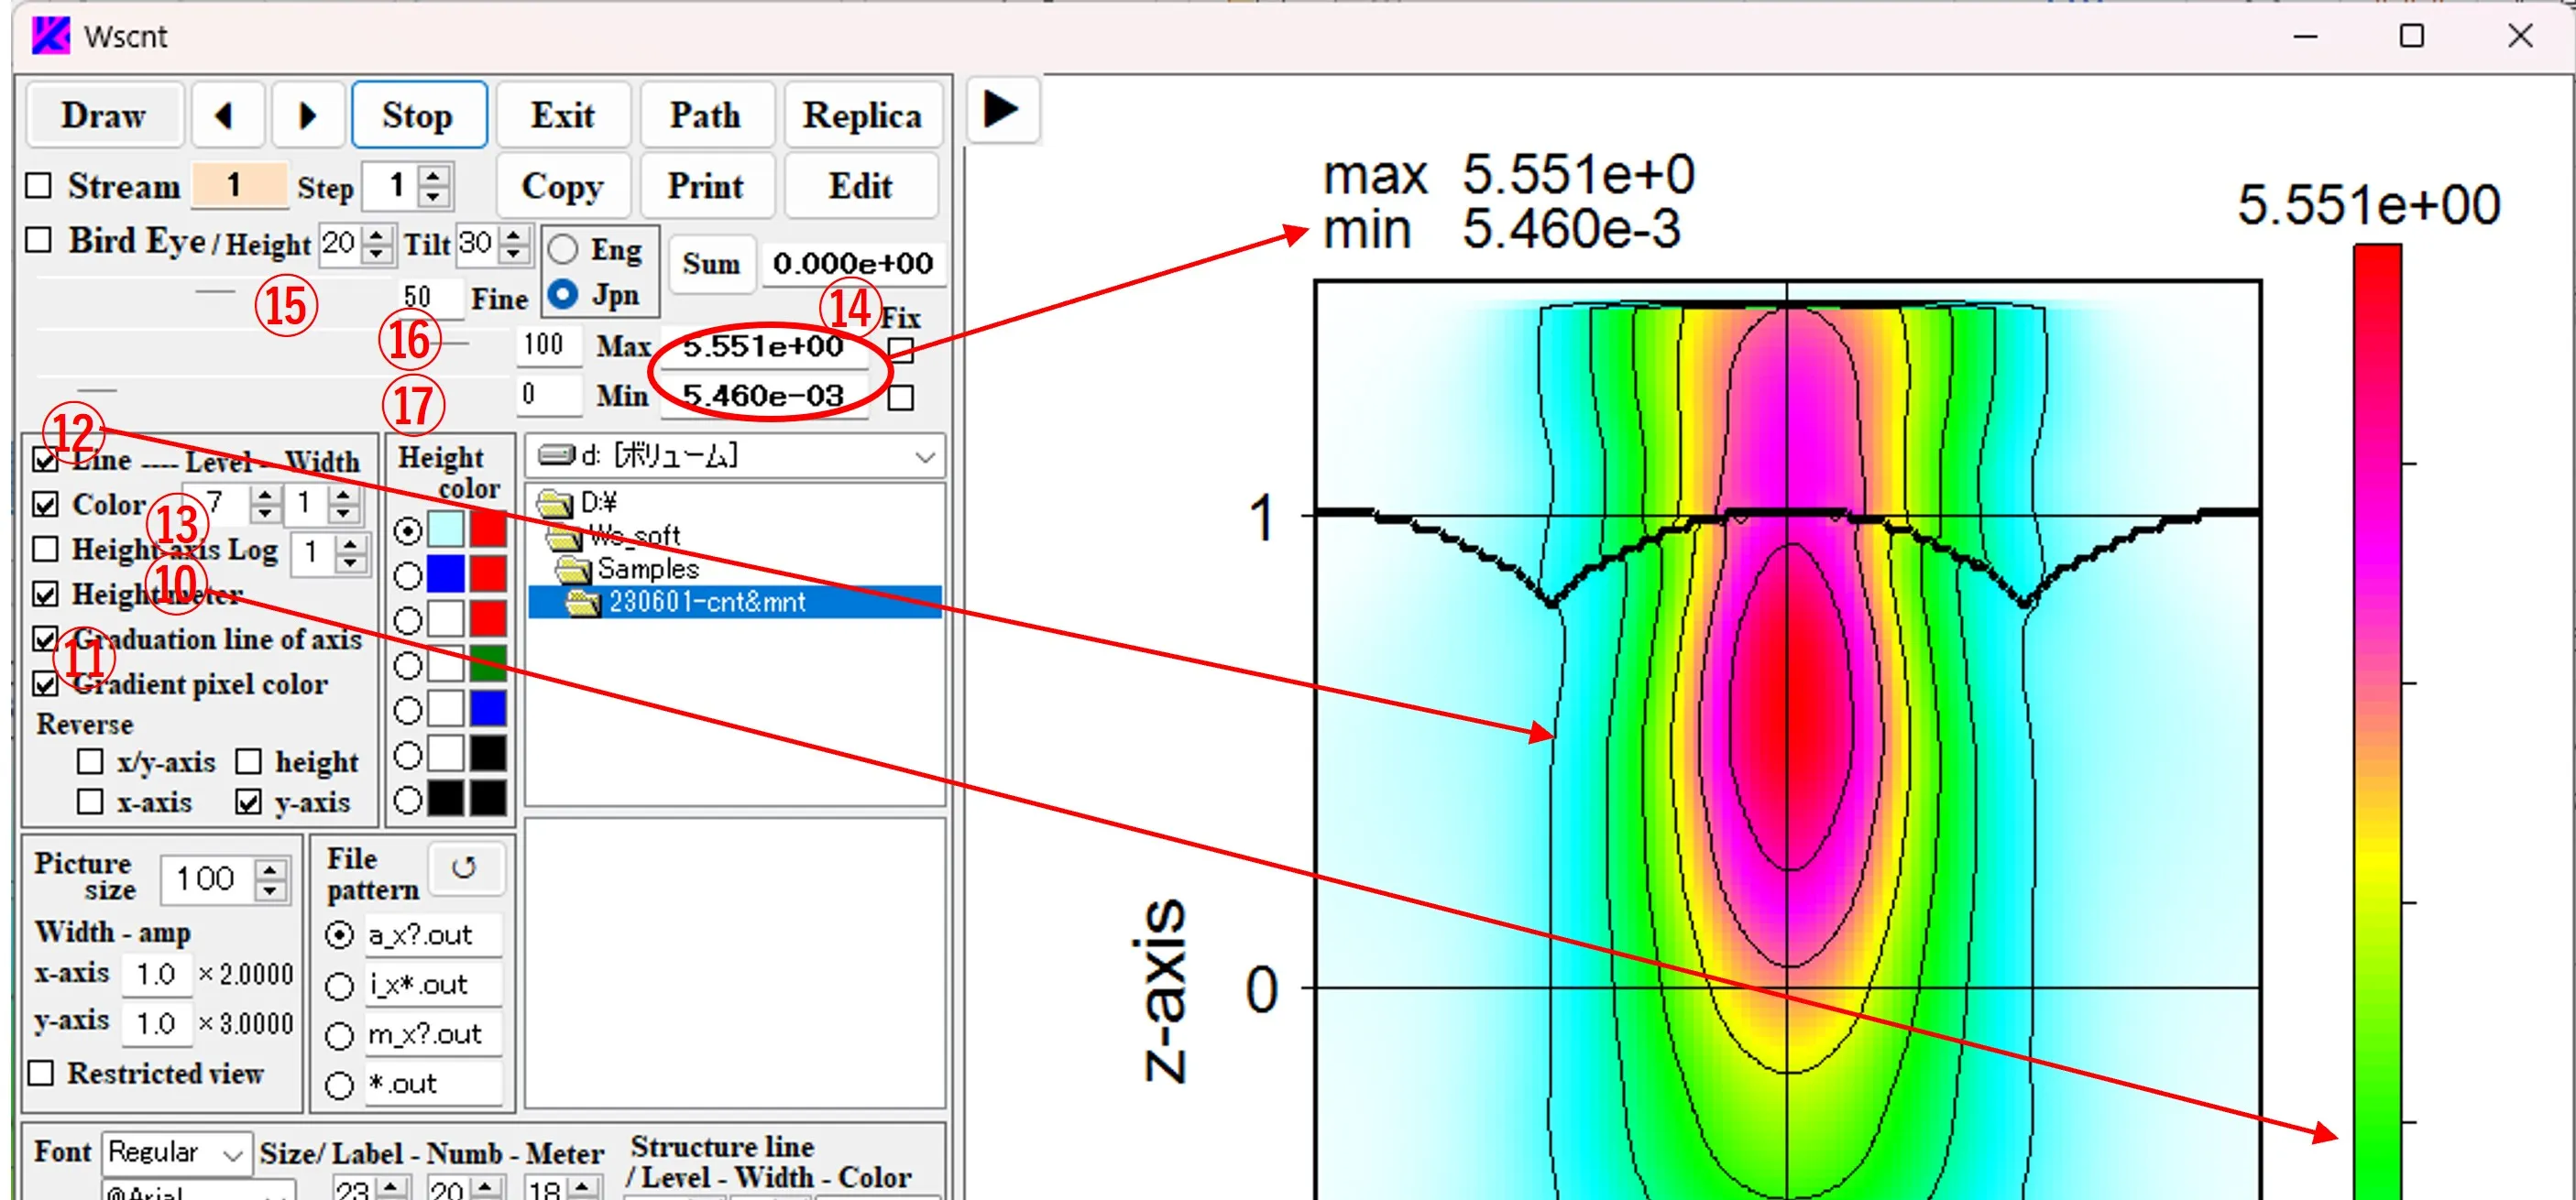
(2) Check boxes ⑩, ⑪, and ⑫ set whether the height meter, scale lines, and contour lines are displayed or not. Box ⑬ means the number of contour levels (the number of divisions between the maximum value “Max” and the minimum value “Min”). “Max” and “Min” for the image data are displayed in box ⑭ and at the upper left corner of the figure. ⑮ is a scroll bar for image definition. The larger the value, the higher the definition and the slower the imaging speed, so about 50 is preferred as a scroll value on the right box. Scroll bars ⑯ and ⑰ determine the level of contour color for the largest and smallest sides, respectively, and their scroll values are displayed on the right.
(3) The clipboard copying by ⑱, printing by⑲ and duplication of images are done by ⑳. Click the Exit button ㉑ to exit the program.
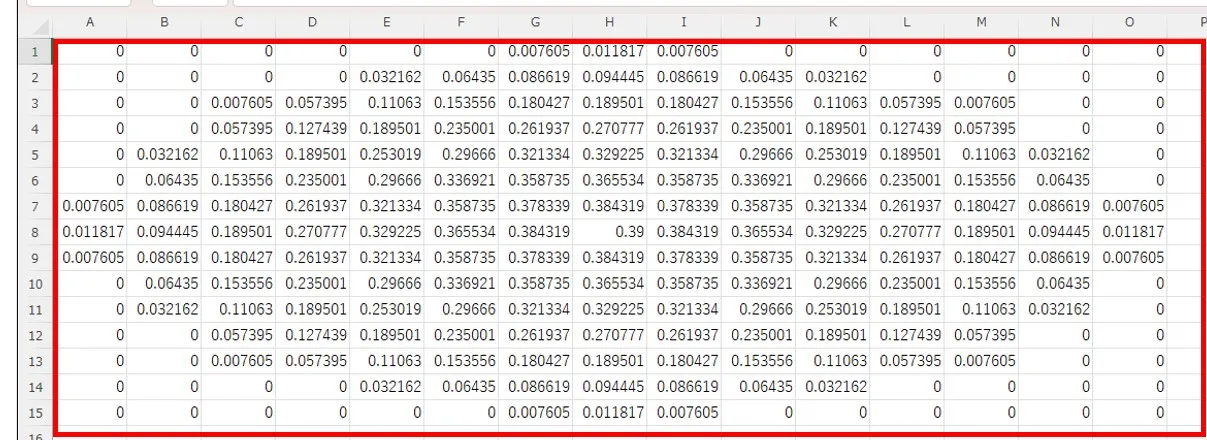
(1) Specify the area you want to convert in the contour data sub_data.xlsx of the Excel file and copy it.
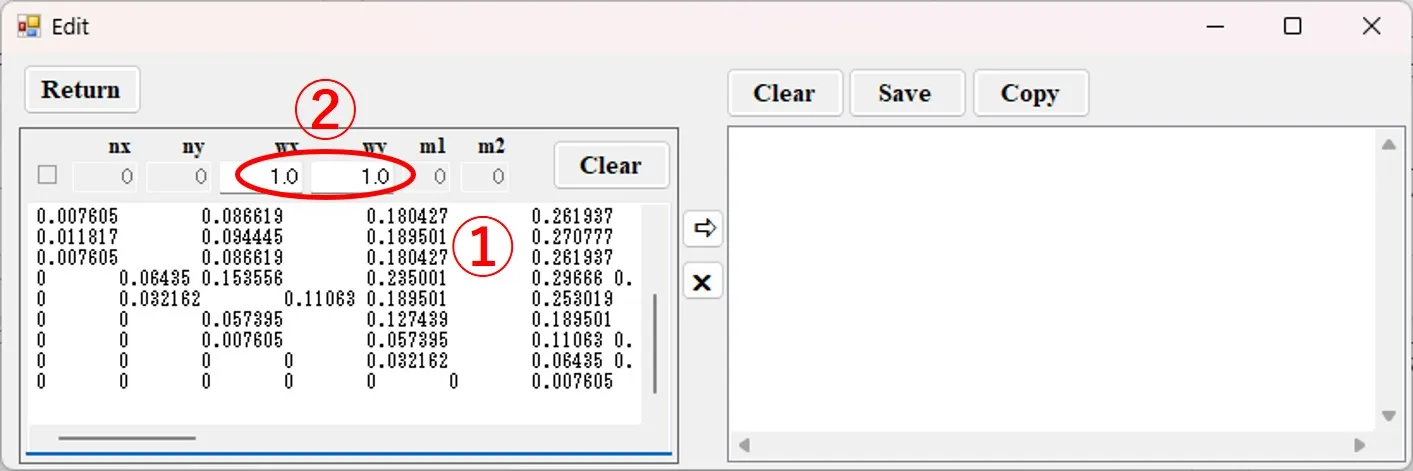
(2) Paste the copy into the left box ① of the Edit window. Set the width ② in the x and y directions of the data.
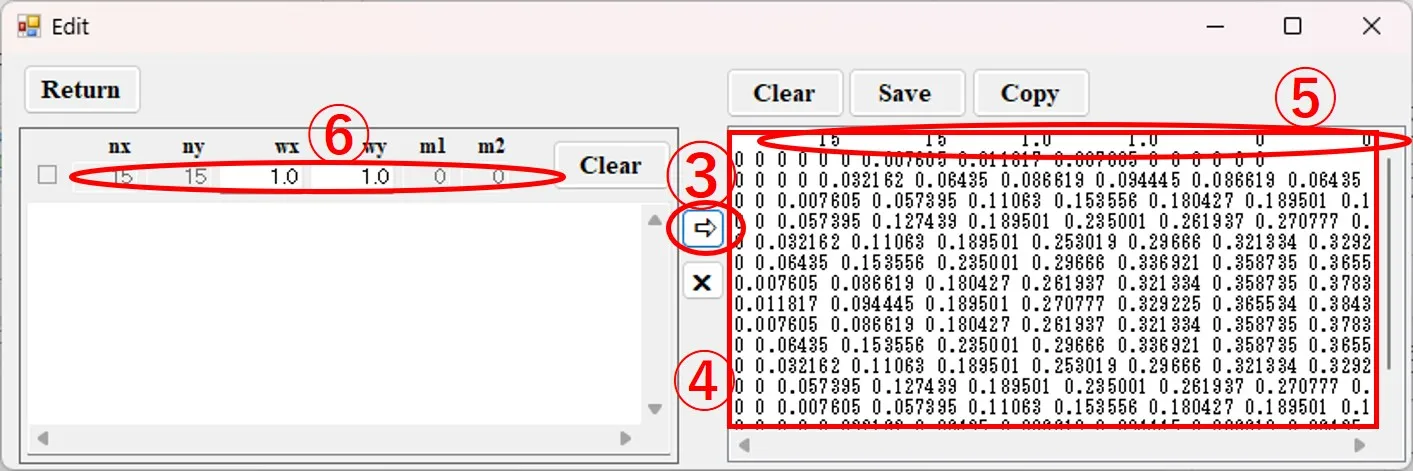
(3) When you click the button ③, the data is converted to a space-separated numeric sequence as shown in ④, the first row ⑤ is added, and it appears in the right box of the Edit window. The first row ⑤ is a 10-column number of 6 columns including the numbers of columns and rows for data, and the width in the x and y directions, and corresponds to the contents ⑥ above the left box.
(4) If you want to add more contour data, copy the corresponding contour data and paste it into the left box ⑦ of the Edit window. Set the width ⑧ in the x and y directions of the data.
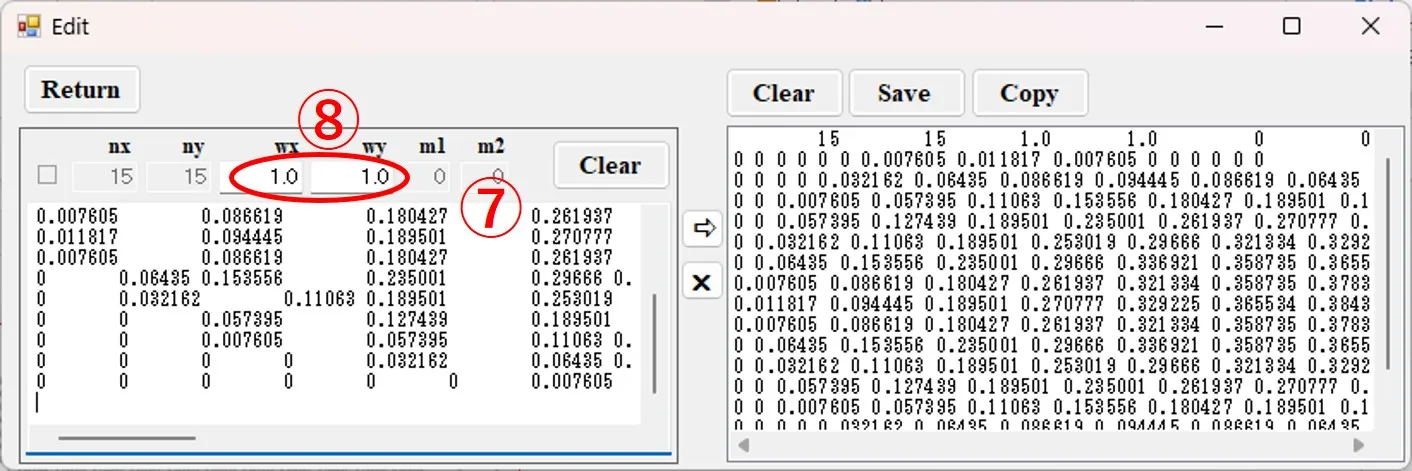
(5) When the button ⑨ is clicked, the data is converted, and the first row is added below the preceding data in the right box of the Edit window as shown in ⑩.
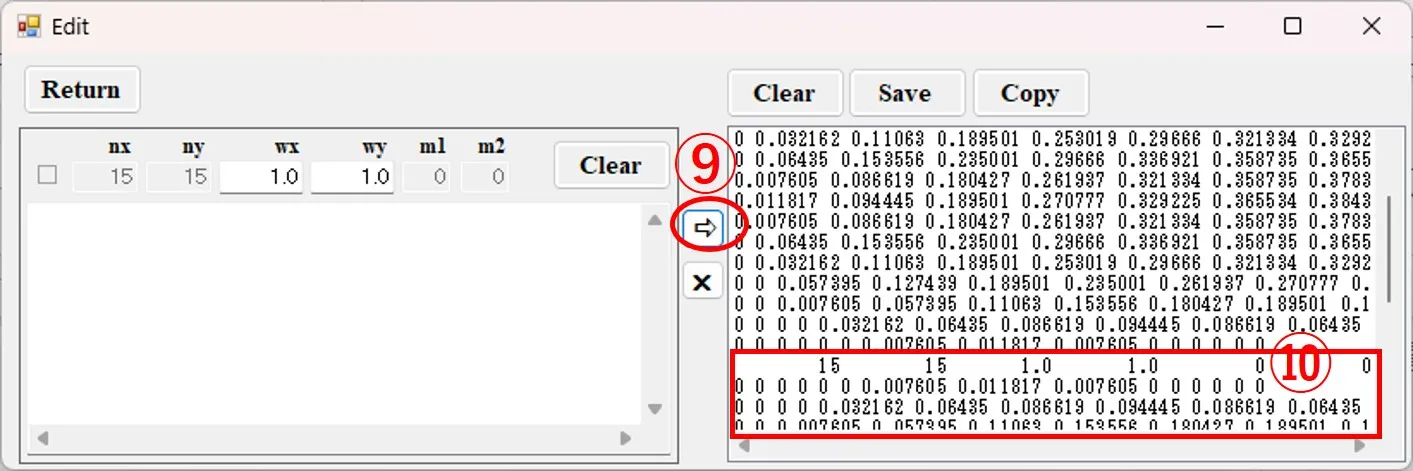
(6) When deleting contour data, the background color for the data changes to orange when the first row ⑪ of the corresponding data is clicked, and the colored part is deleted when the button ⑫ is clicked.
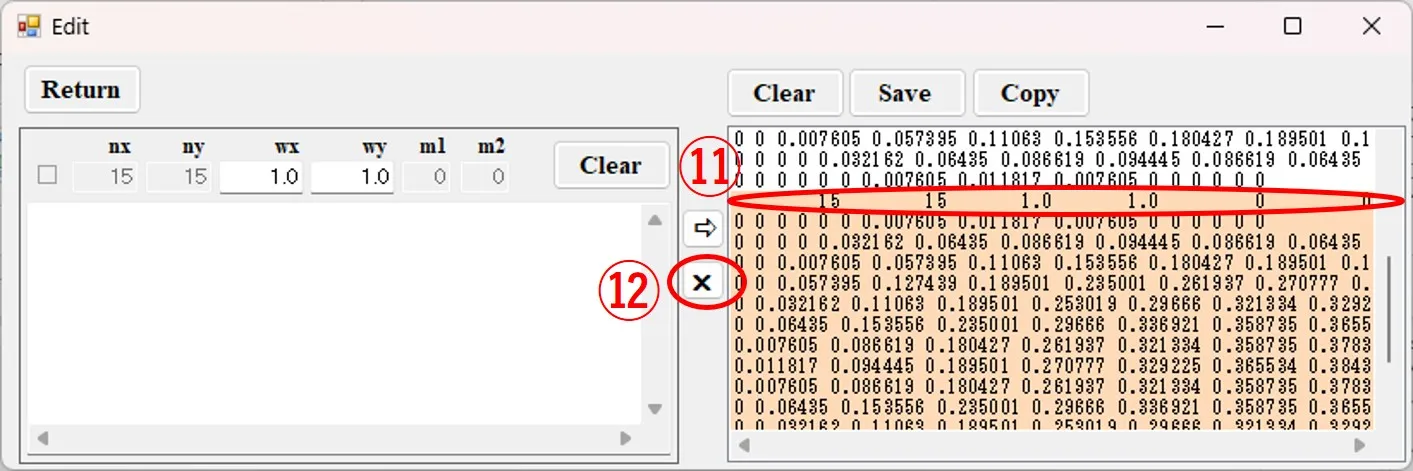
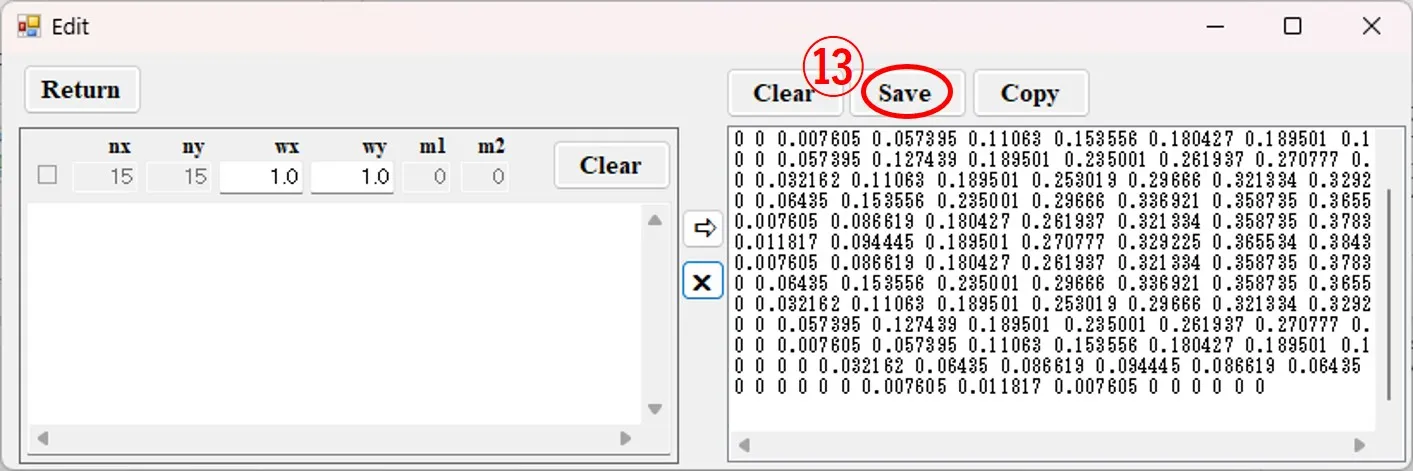
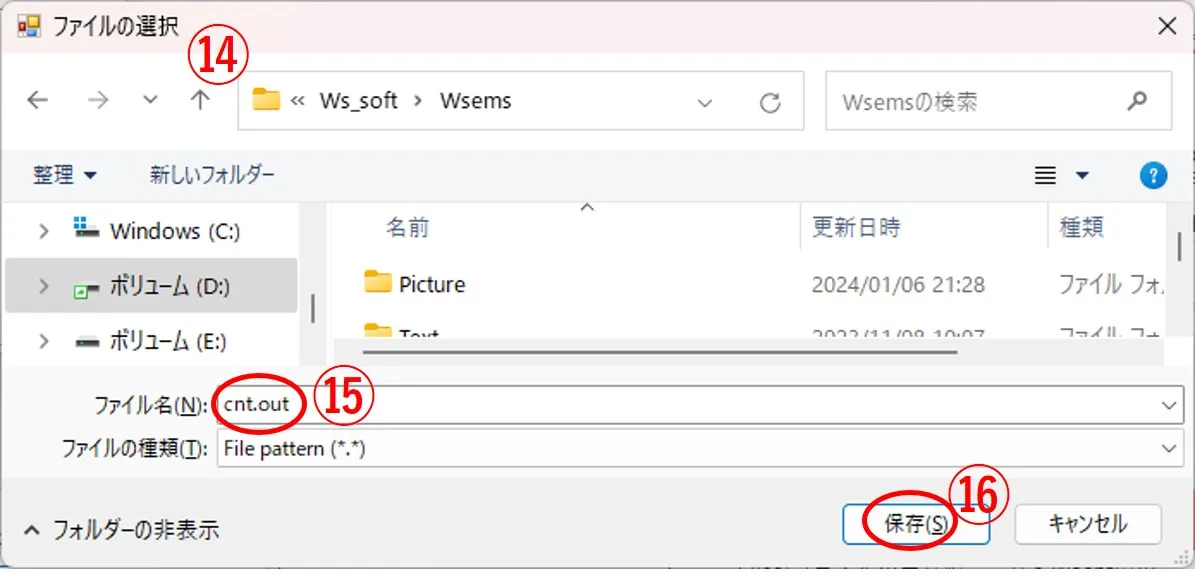
(7) When the button ⑬ is clicked, the file selection window ⑭ appears, the file name ⑮ is entered, and the button ⑯ is clicked, and it is saved as drawing data for Wscnt. All output data generated by Wsf, Wsr, Wsb, etc., such as i_xz.out and i_xz_t.out, are rendered data for Wscnt.
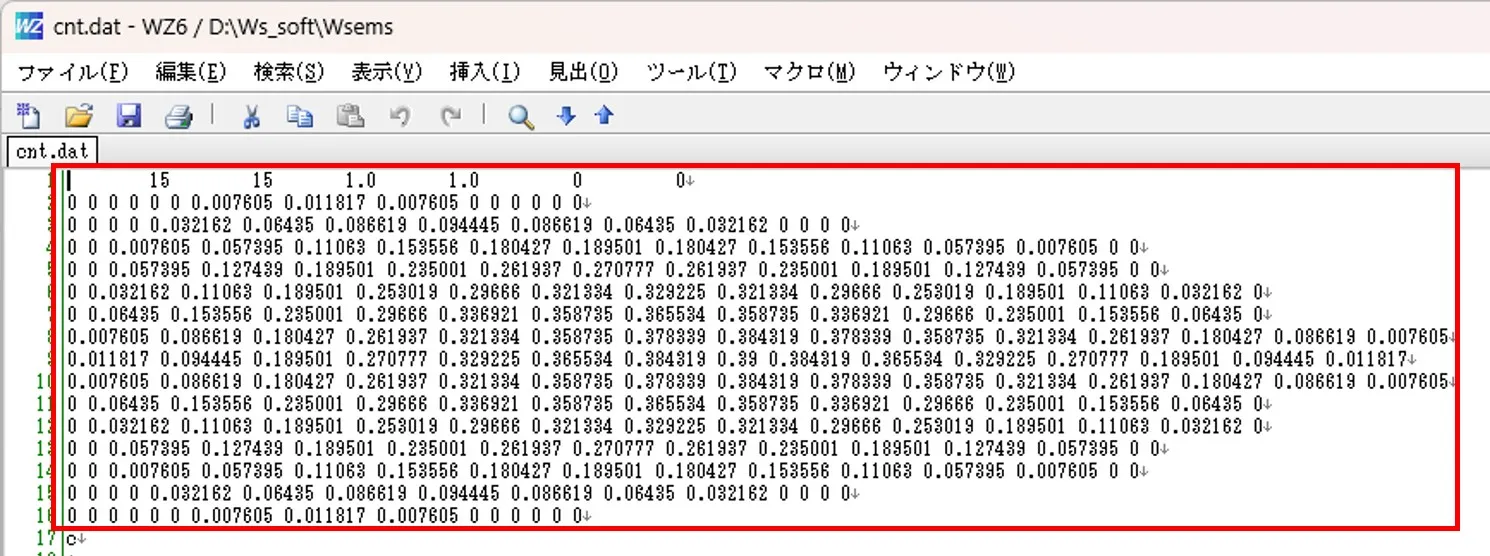
(1) Call and copy the existing drawing data for Wscnt in the editor (Notepad).
(2) Copy and paste in the left box ① of the Edit window. When the button ② is clicked, the drawing data for Wscnt appears in the right box of the Edit window as shown in ③. In this case, since the first row is included in the pasted data, the setting of the width ④ in the x and y directions does not work. When the button ⑤ is clicked, it is saved as drawing data for Wscnt.


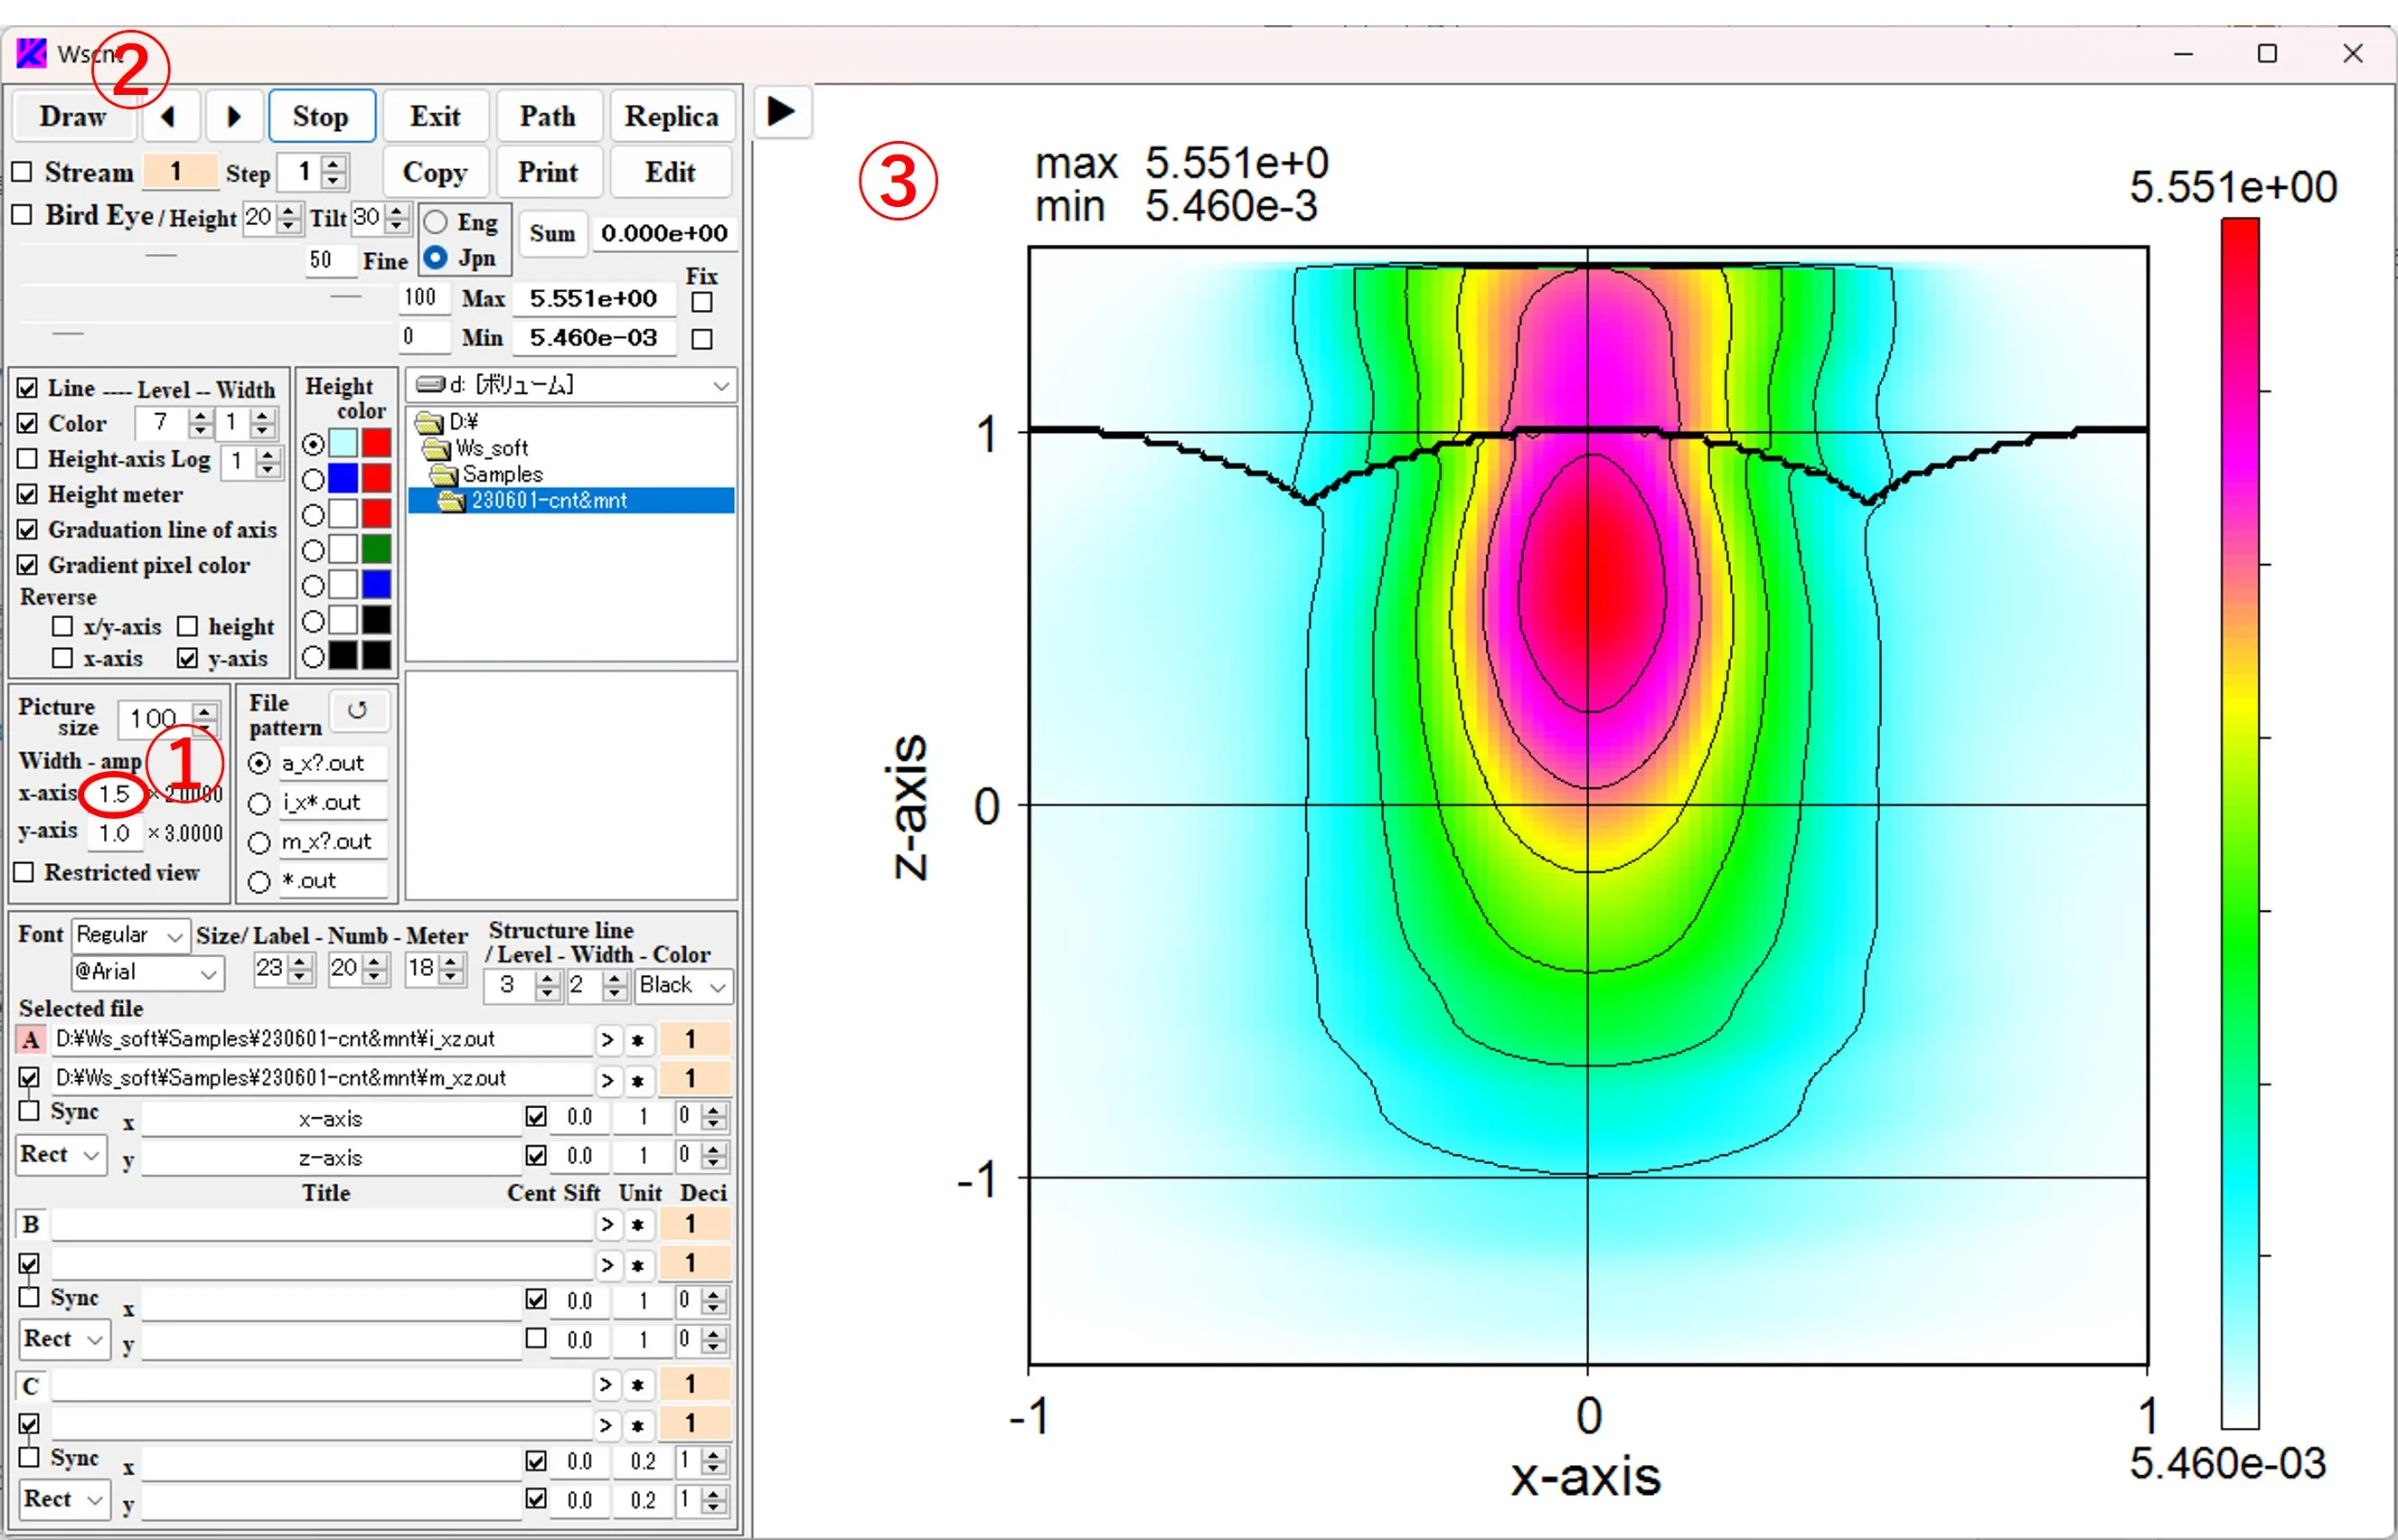
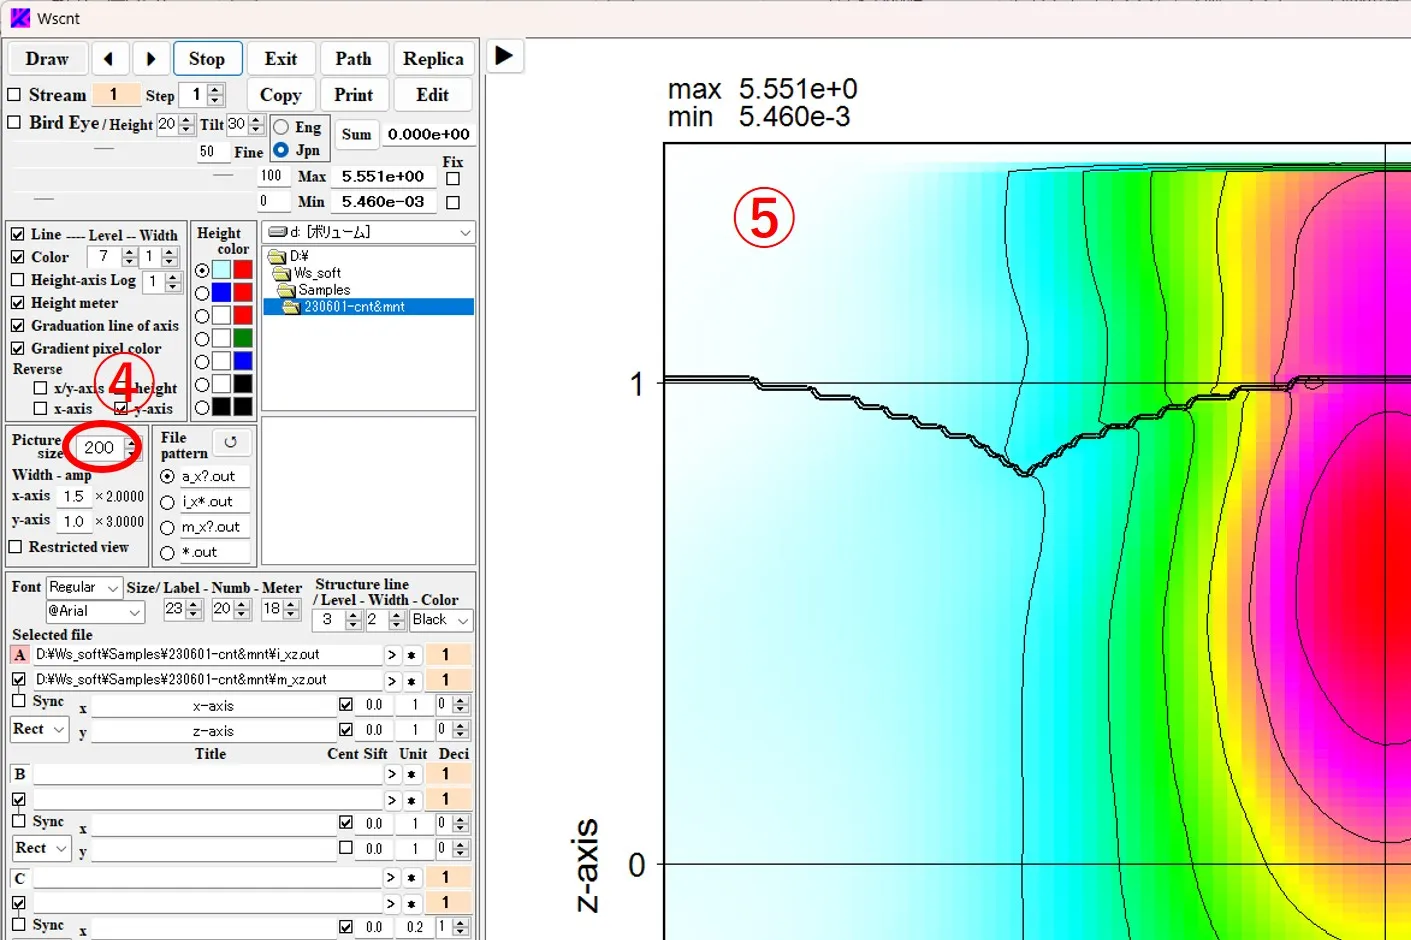
(2) When the box value ④ (% magnification value) next to Picture size is changed, the overall scale of the image expands and contracts as shown in ⑤.
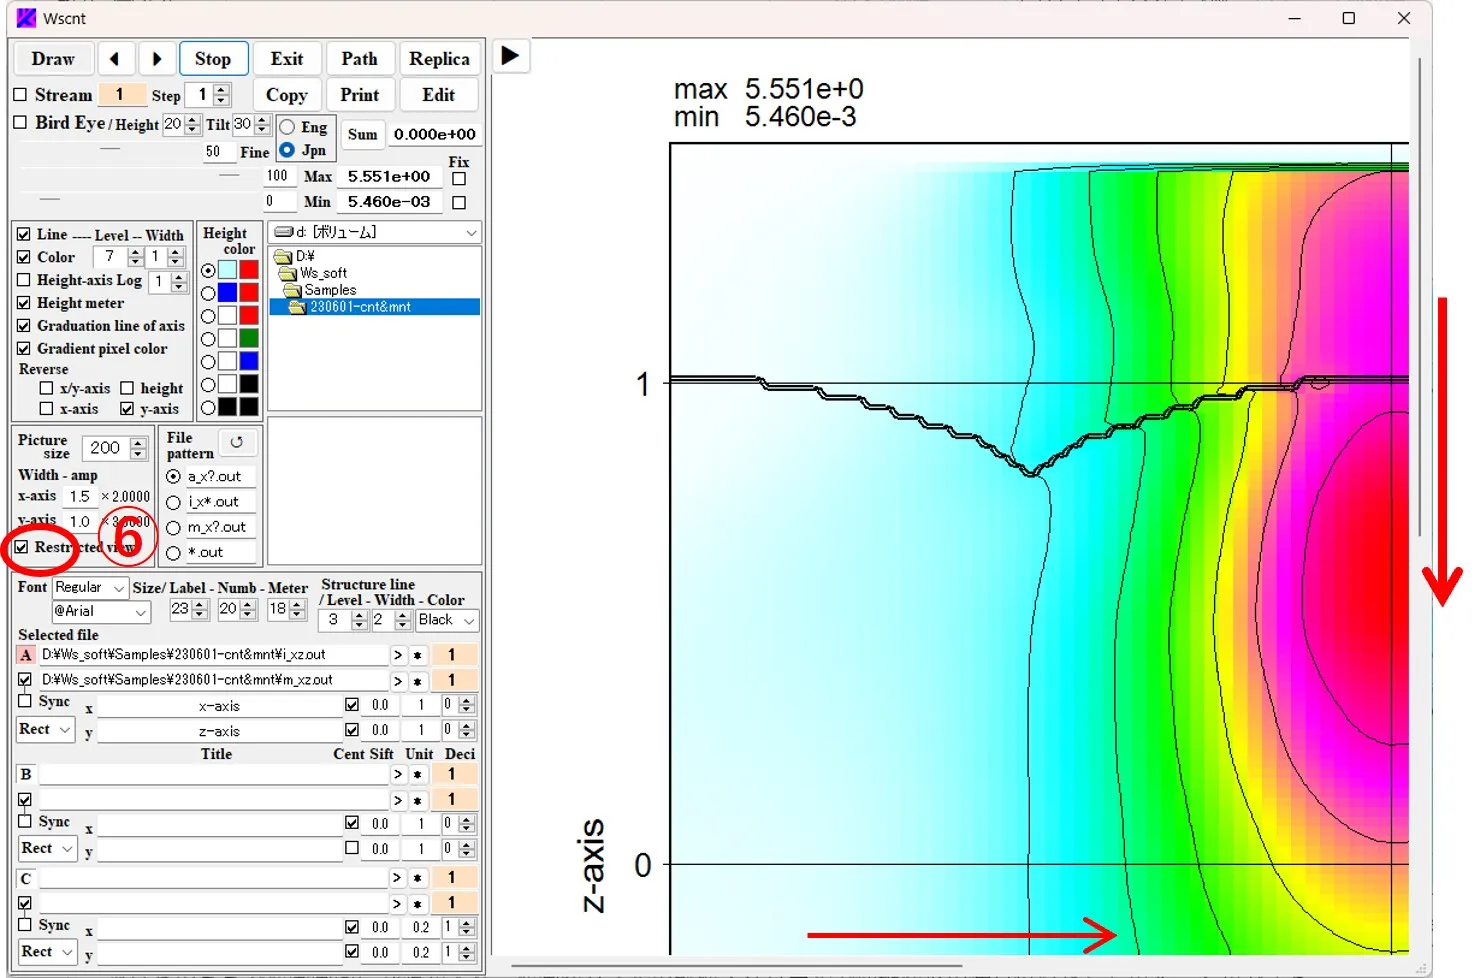
(3) If you check ⑥ and click the Draw button ②, the drawing screen is restricted while the stretch magnification remains the same, and you can move any position of the stretched figure by scrolling vertically and horizontally in the drawing drawing panel.
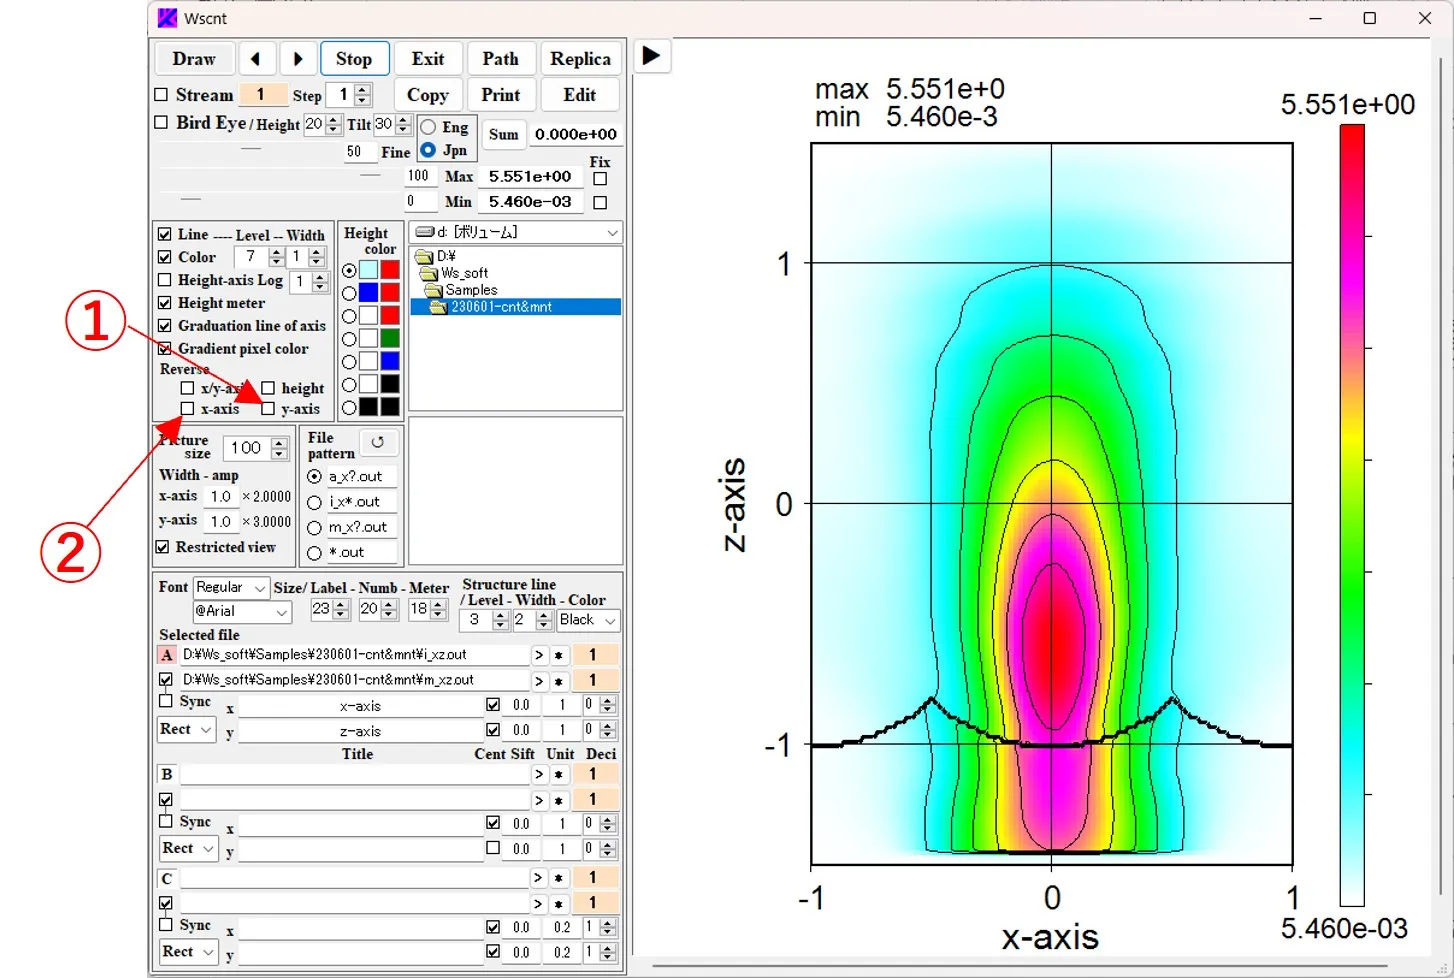
(2) Checking the X/y_axis button ③ switches the X-axis (horizontal axis) and Y-axis (vertical axis).
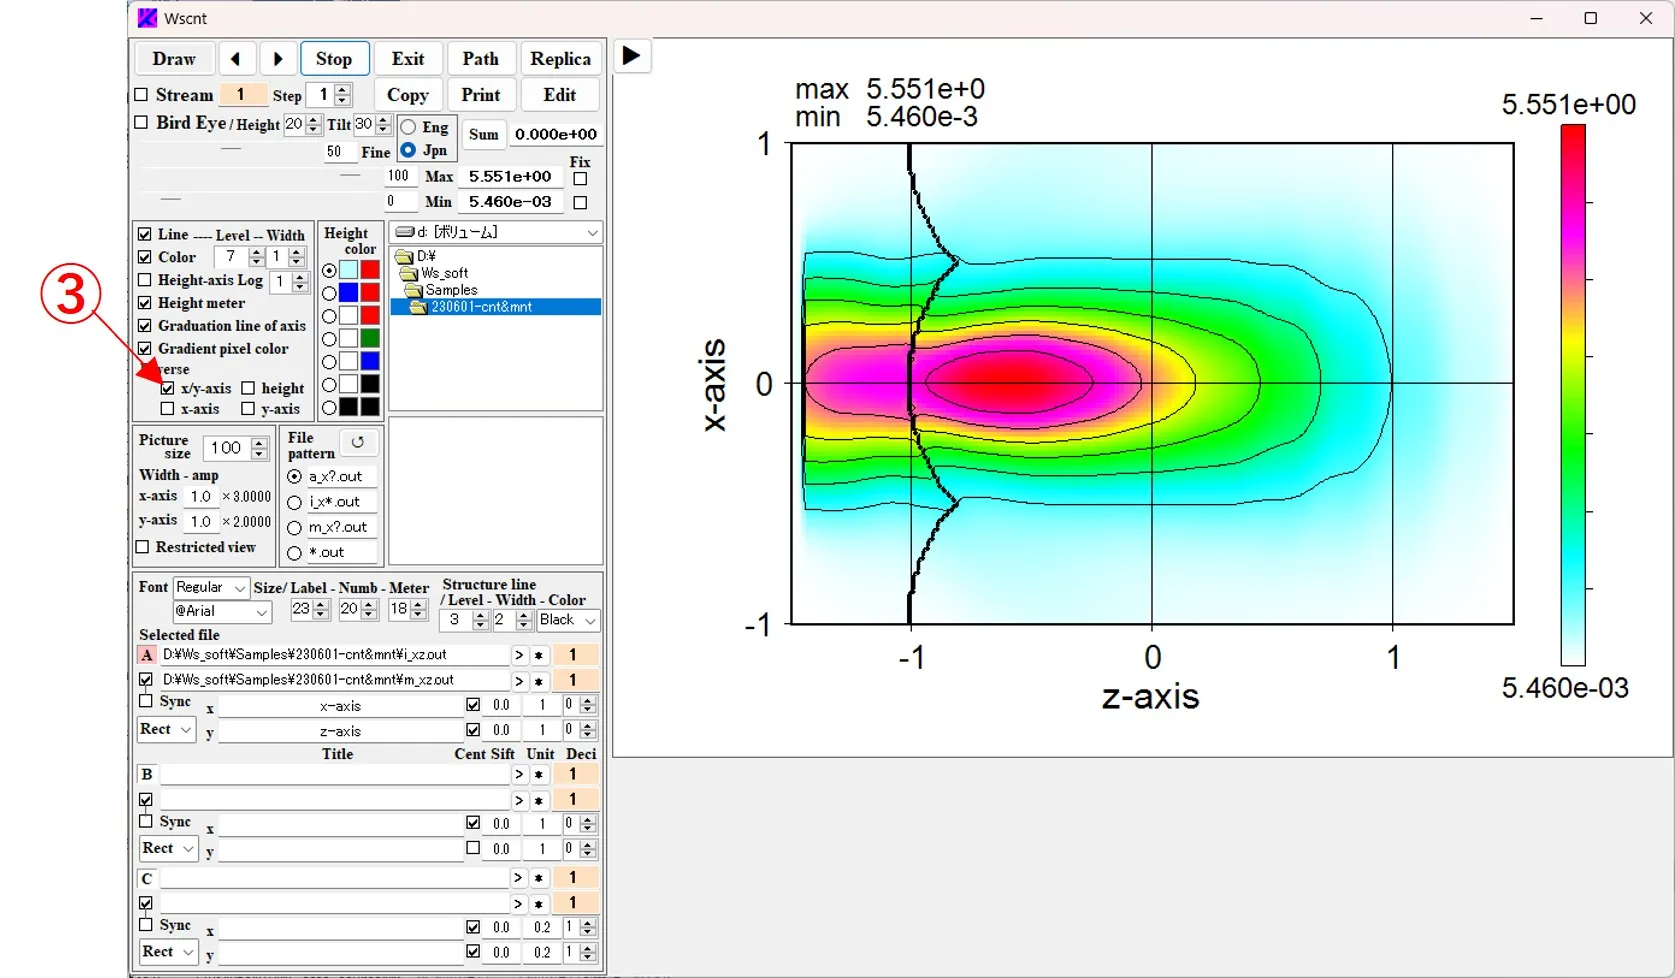
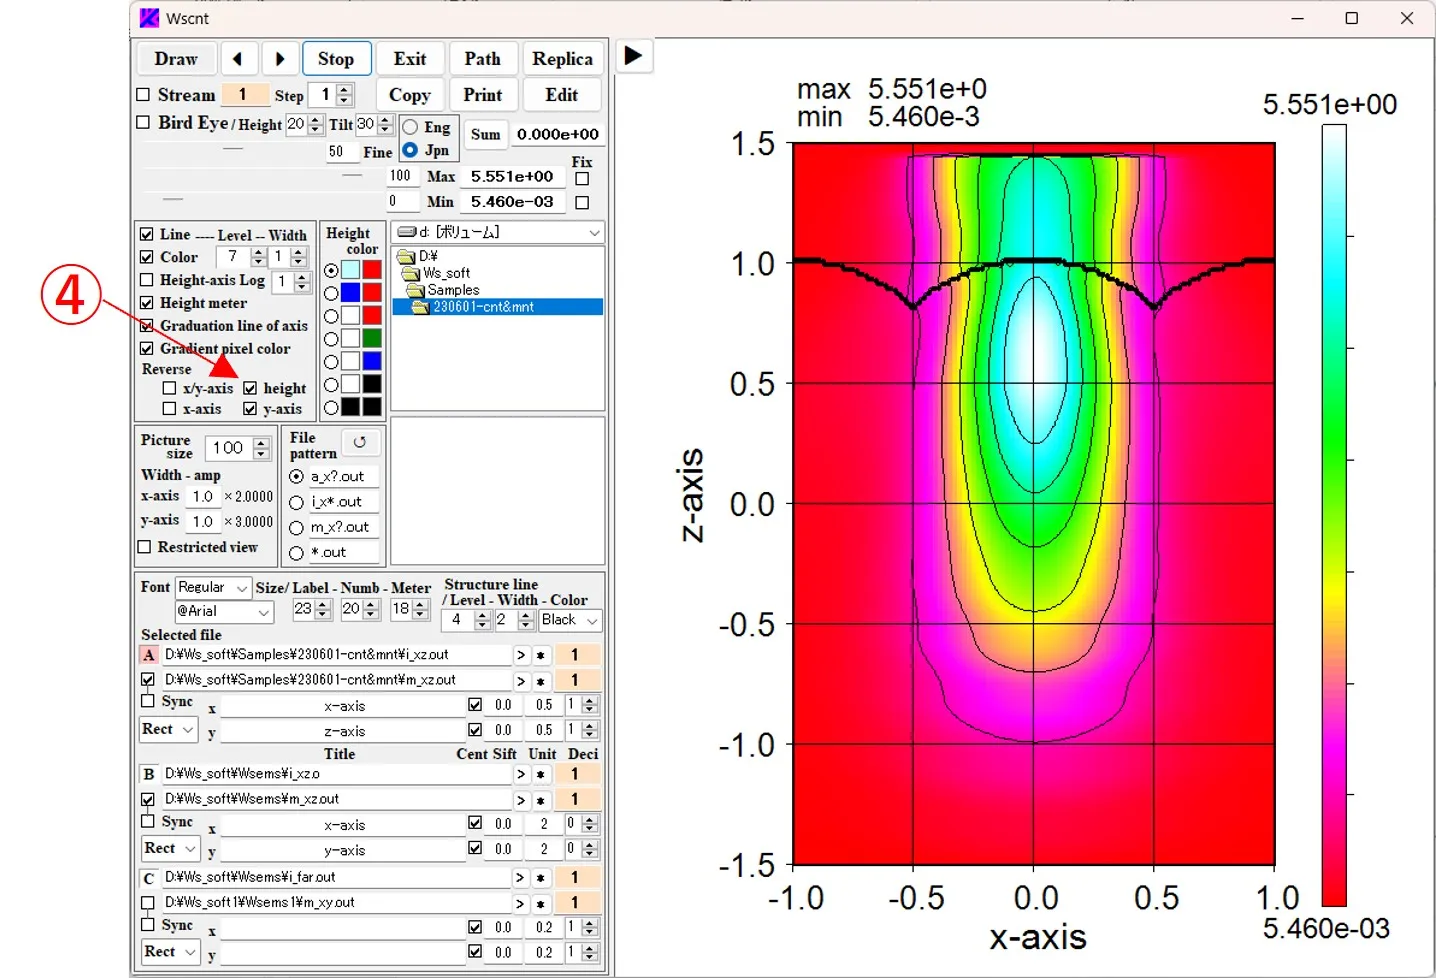
(3) Check the Height button ④ to reverse the high and low axes.
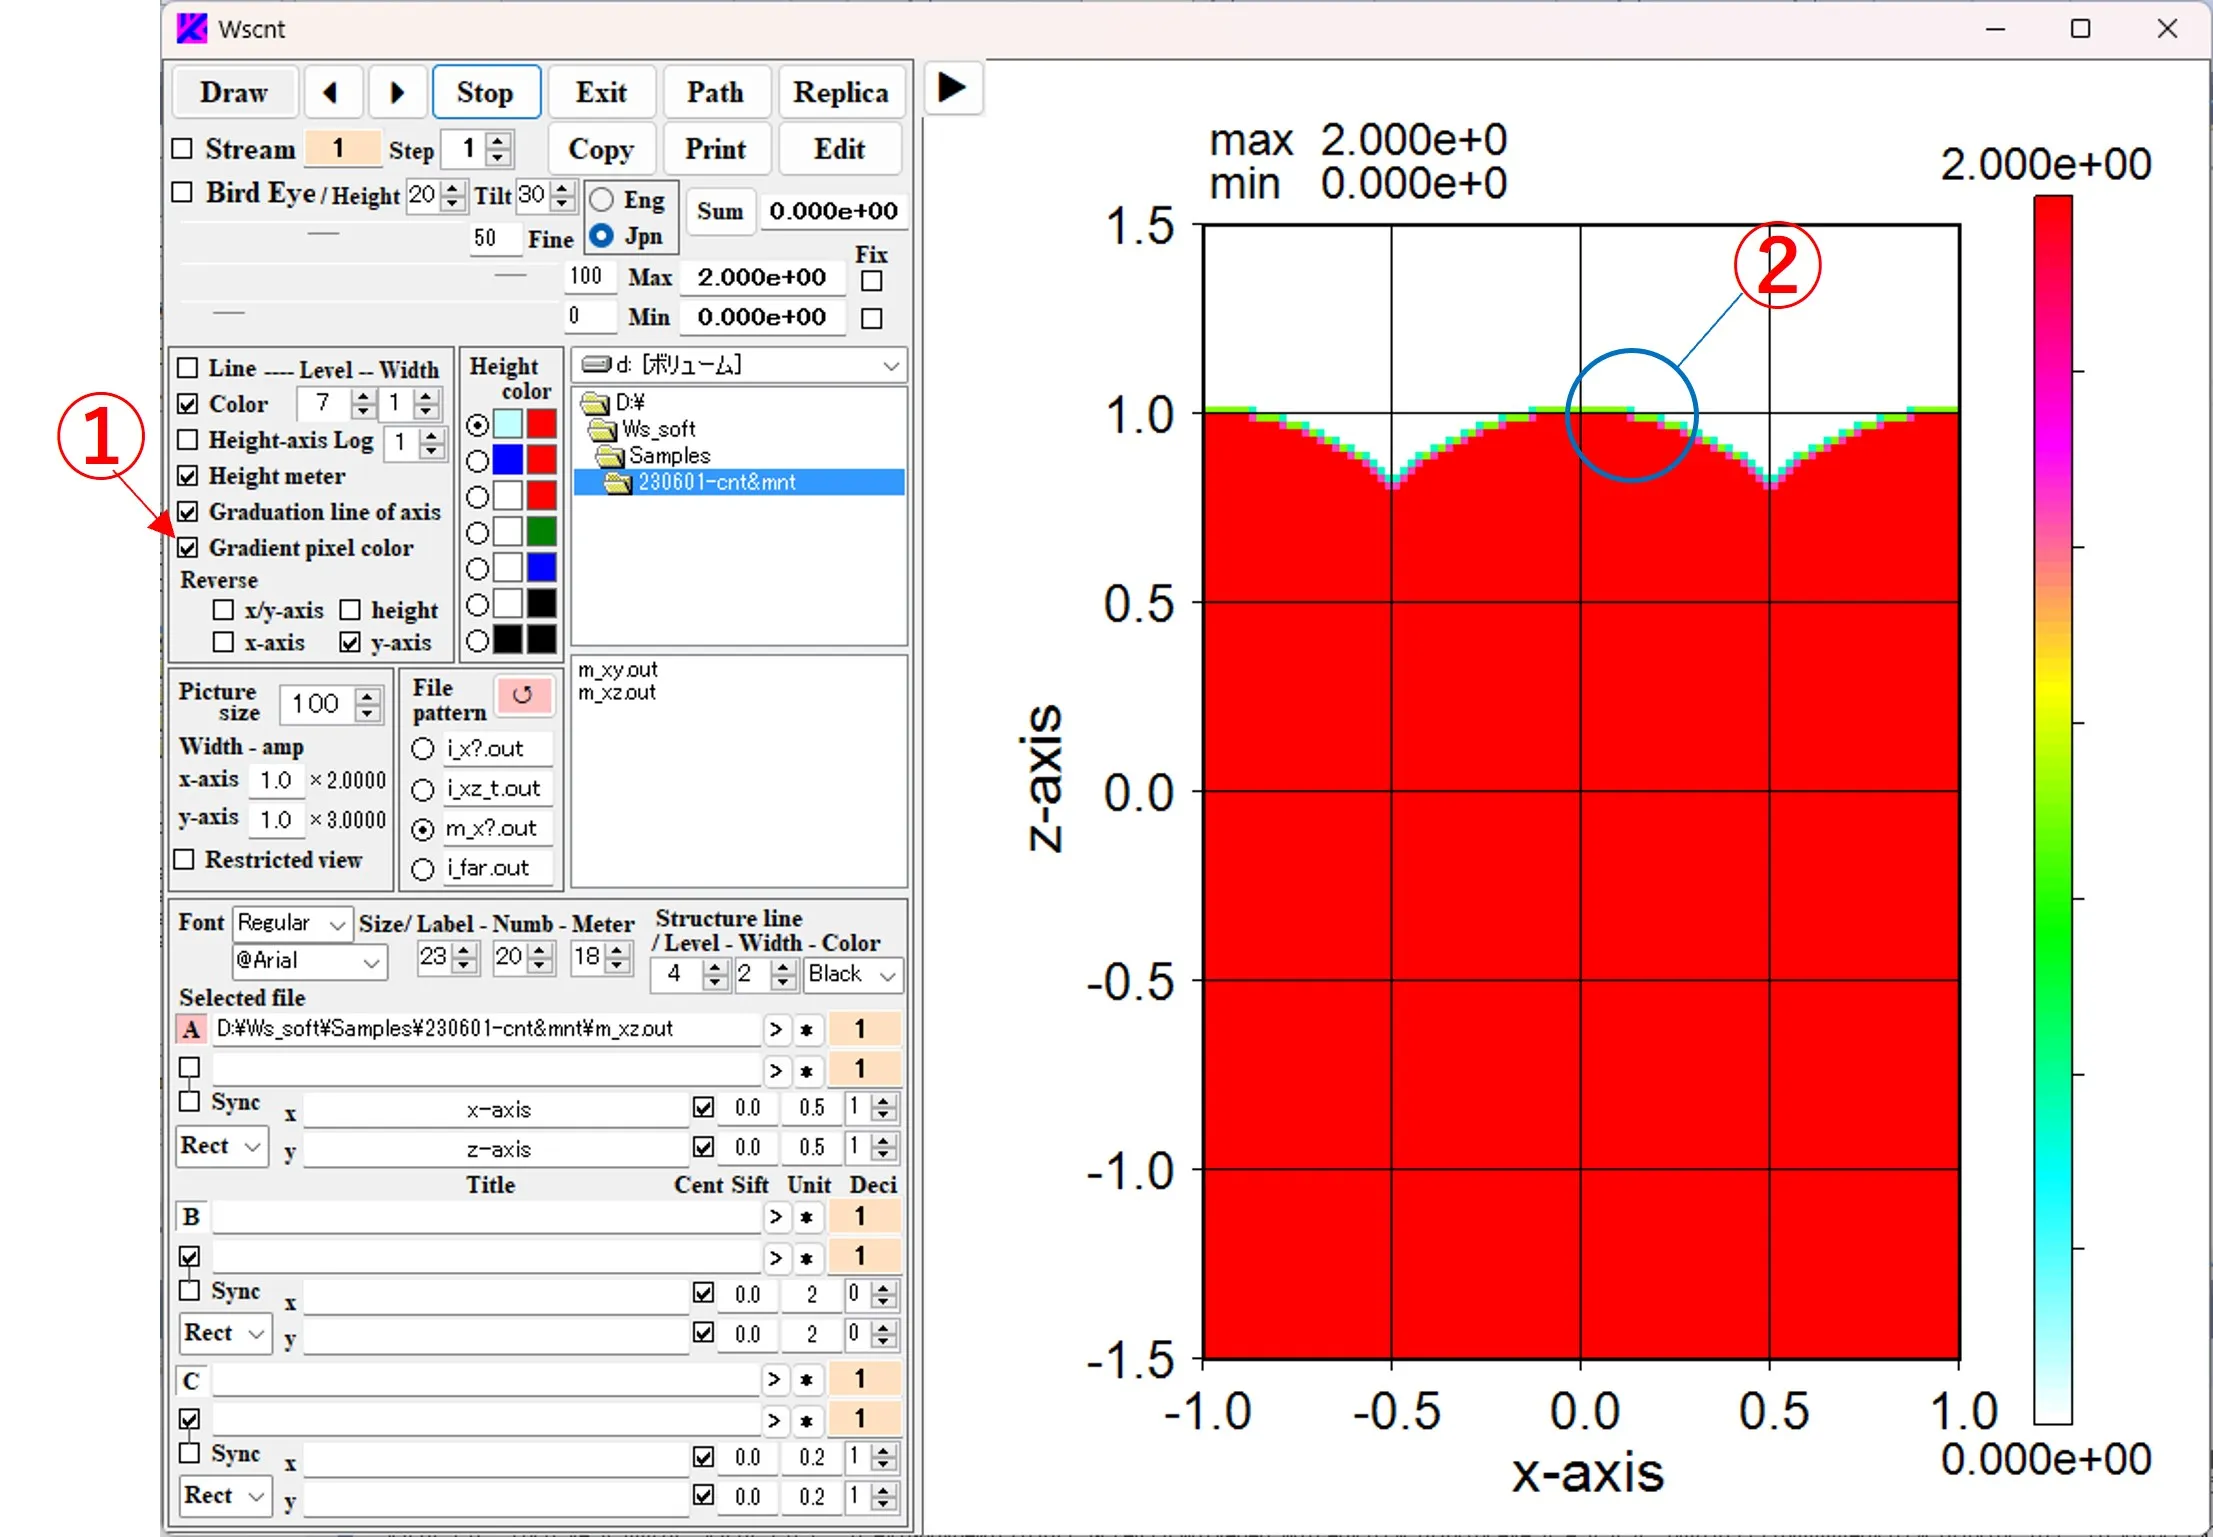
(2) Box ① is not checked→ ③ No leveling process with peripheral pixels
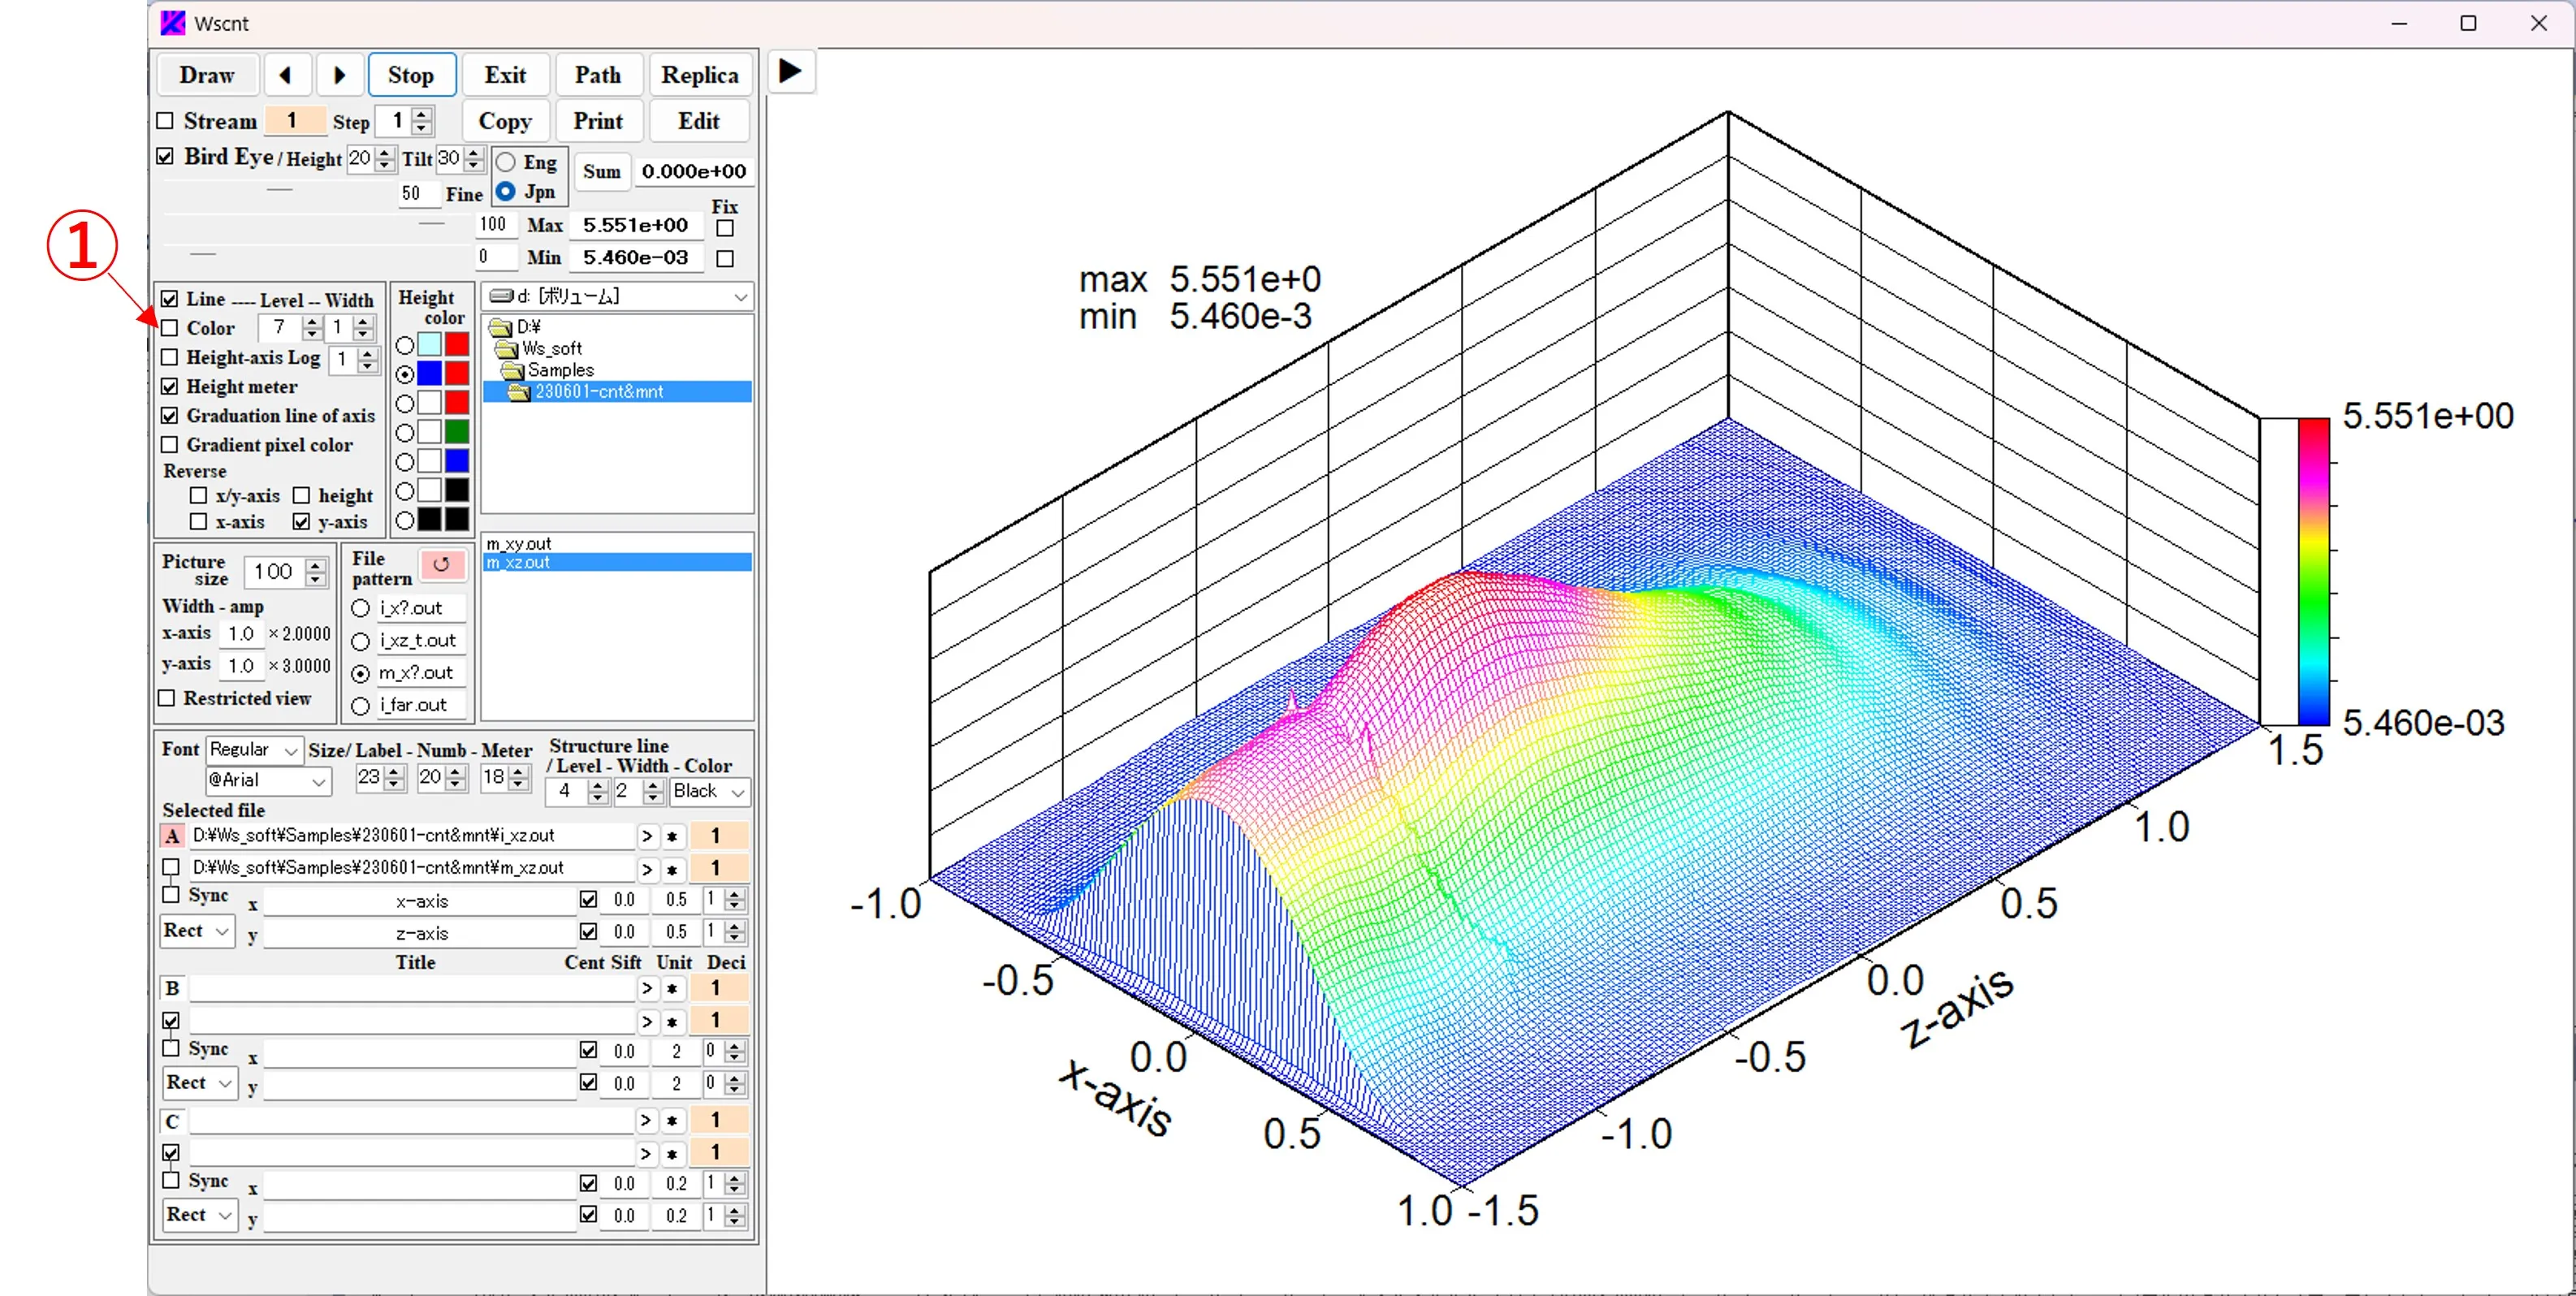
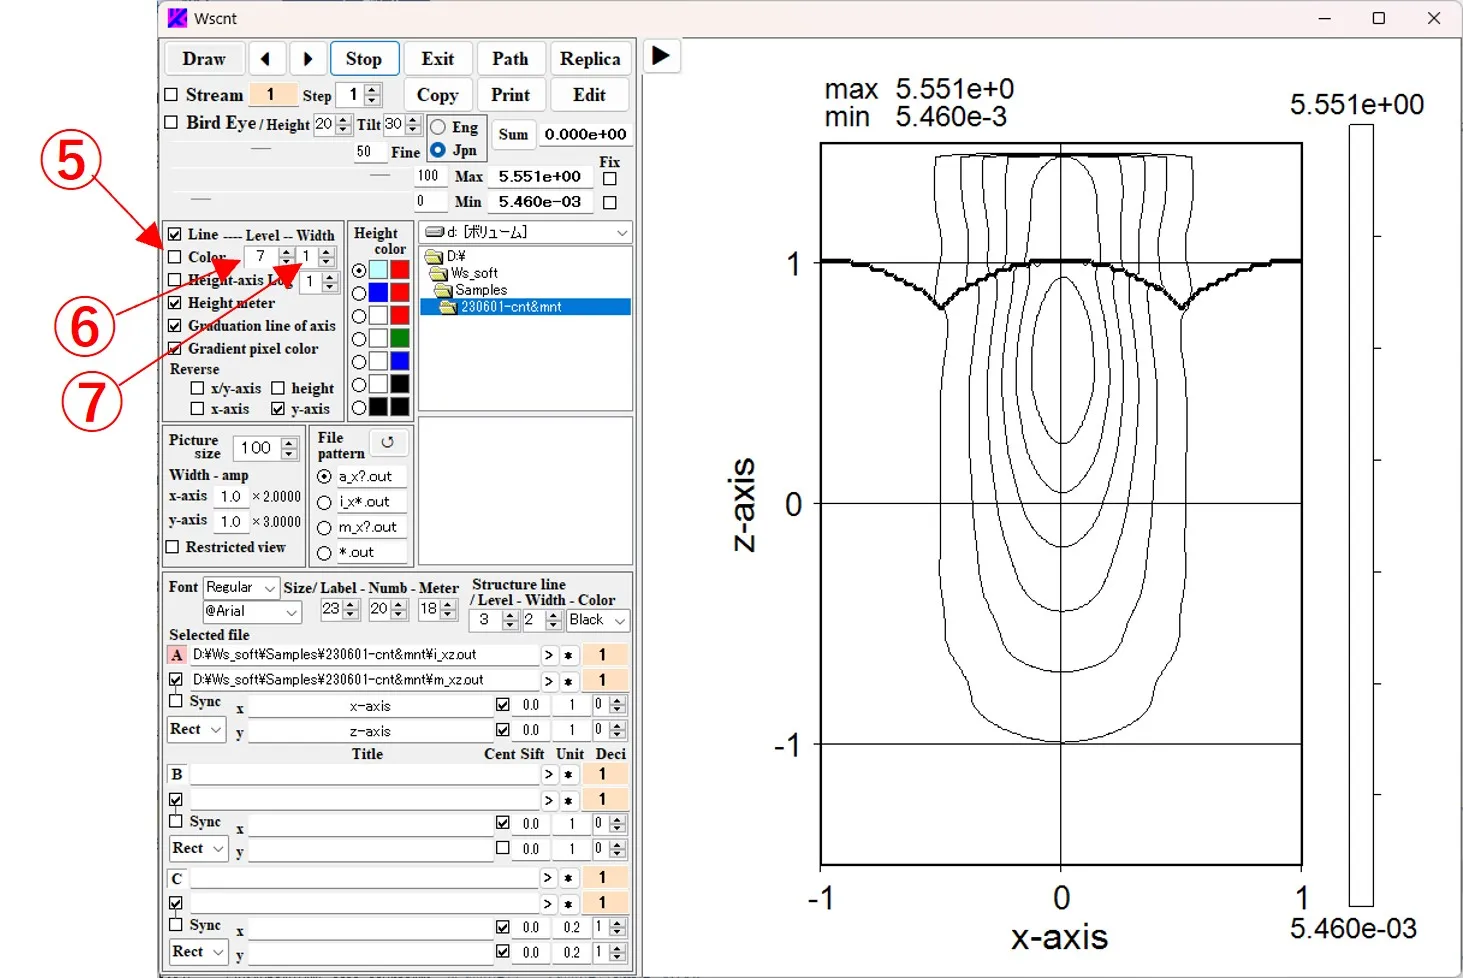
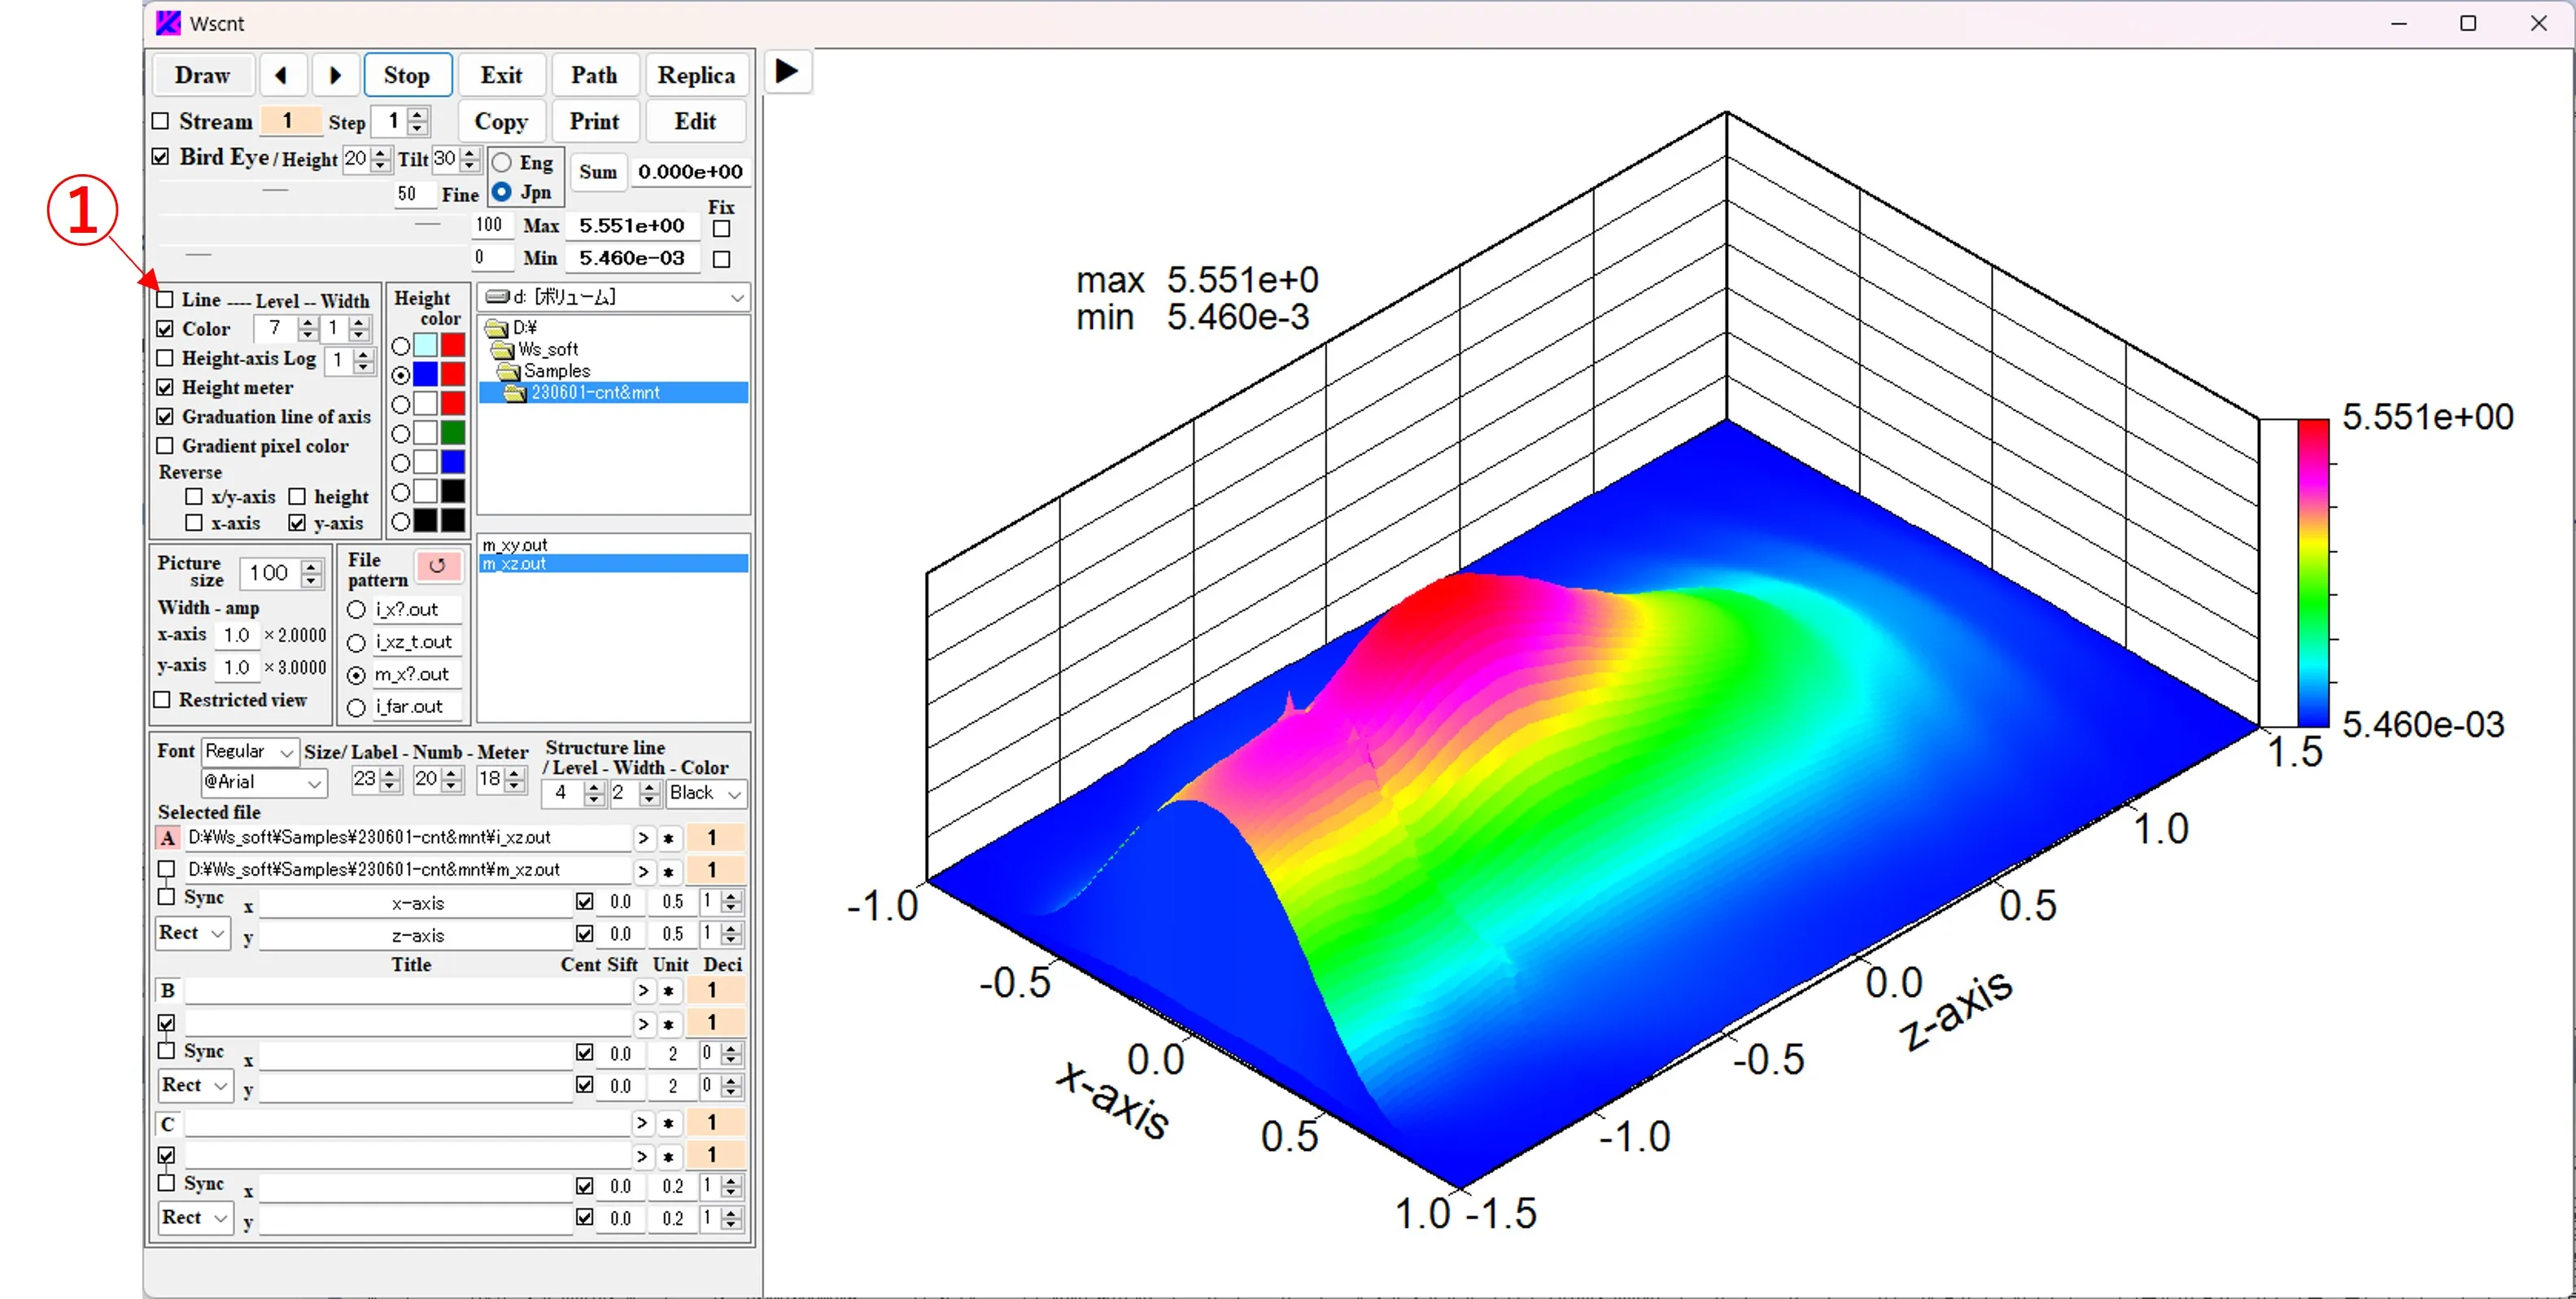
(2) Display without mesh: If you uncheck the Line box ①, only contour colors will be displayed.
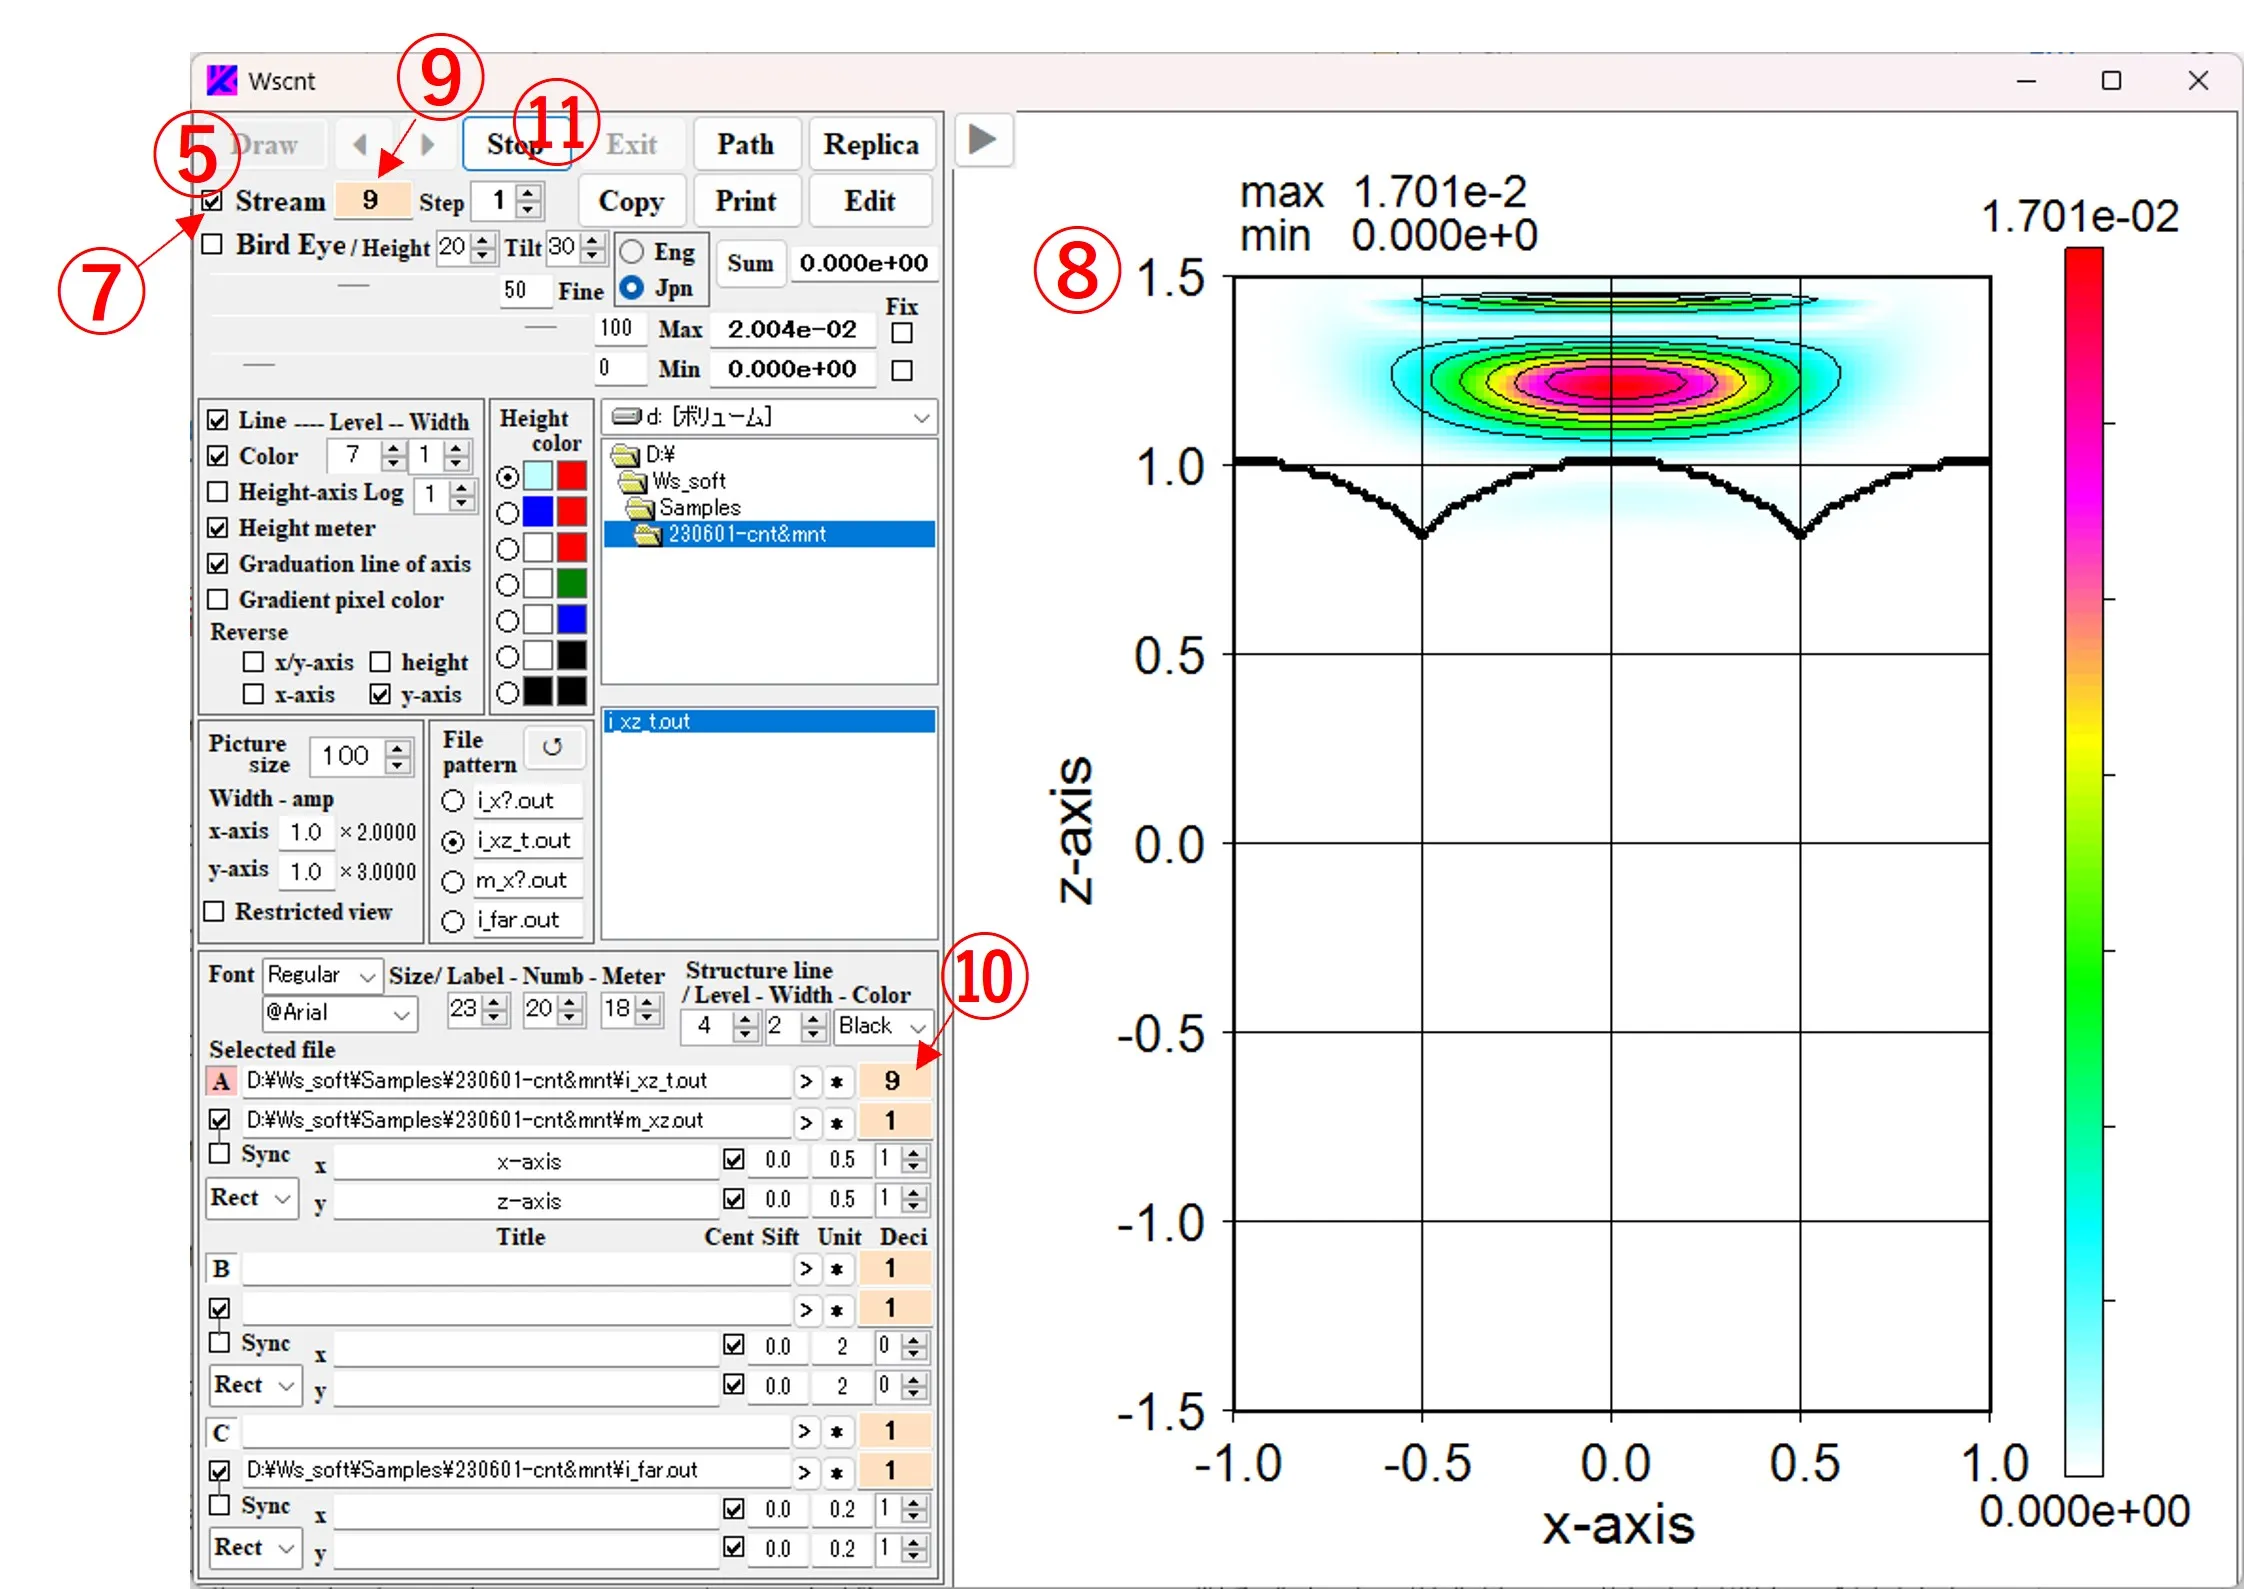
(2) If you click the button ⑦, check the box and click the Draw button ⑤, the contour image ⑧ is continuously rewritten until the final data, and the order of the displayed images is displayed in boxes ⑨ and ⑩. If you right-click the Stream button ⑦, "Stream" will change to "Cycle" and continuous drawing will be repeated. If you click the Stop button ⑪, the rewriting will be interrupted in the middle. Note that when the drawing data is a combination of i_xy.out and m_xy.out, both are continuous data that is synchronously stacked and that the sync button ④ should be checked at the time of drawing.
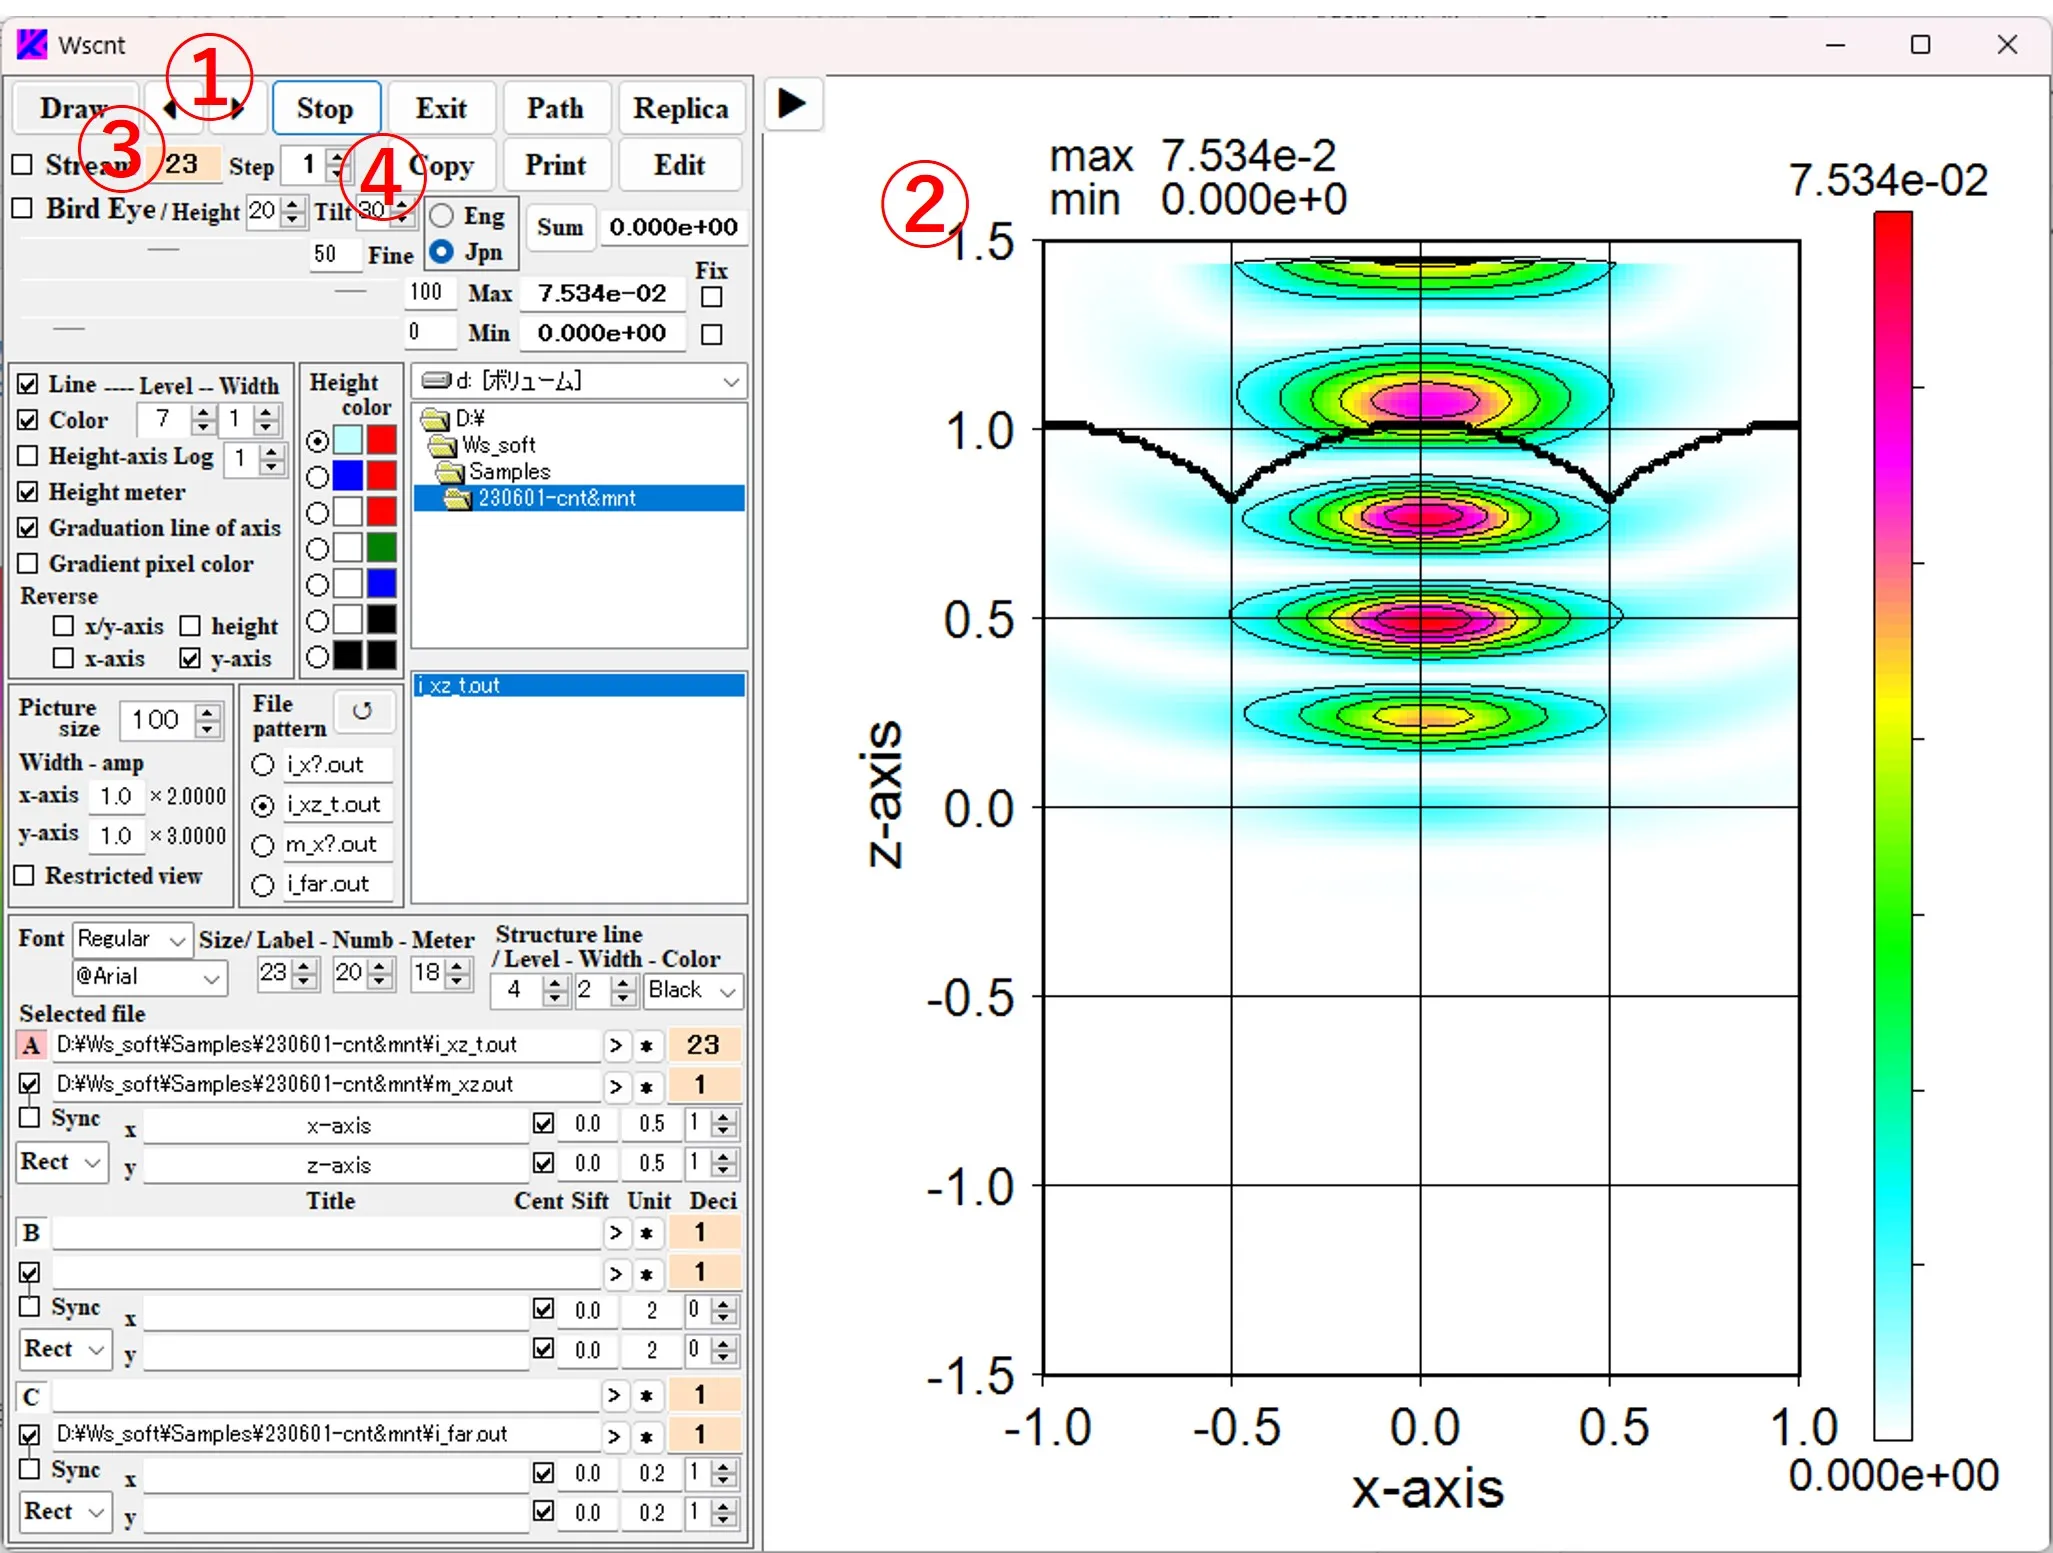
(3) By clicking the buttons ① of ◀ and ▶ , the order ③ of the serial images ② is moved back and forth. The step width of the feed can be set with the button ④.
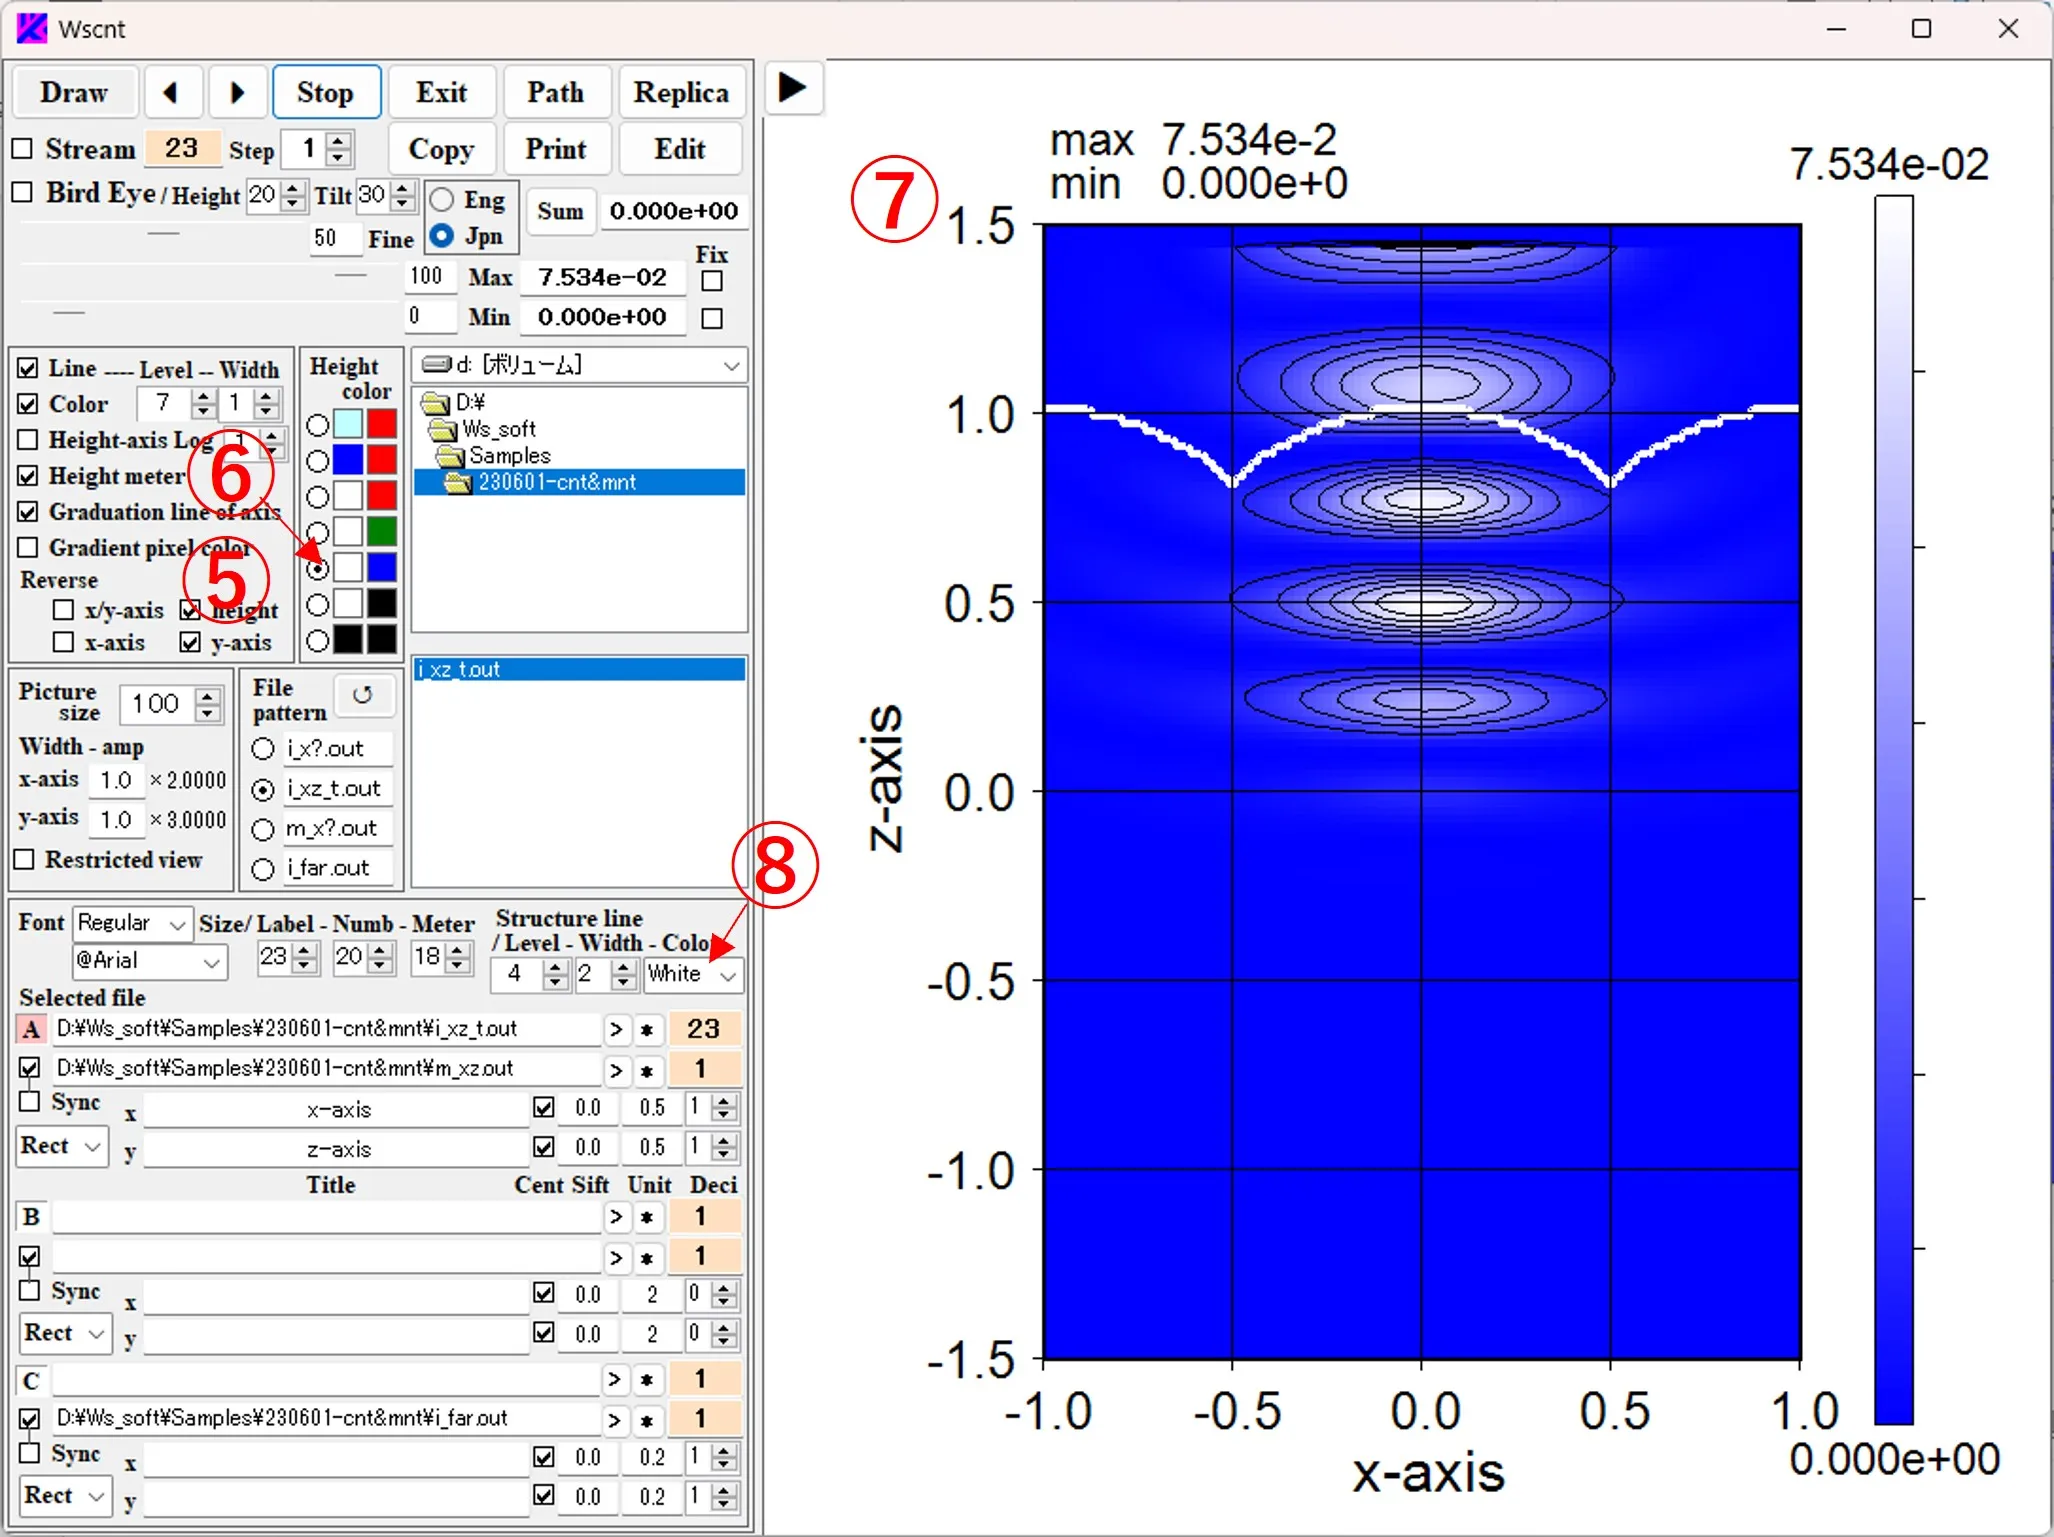
(4) Check the Height box ⑤ to reverse the height relationship of the contour color. When the contour color selection button ⑥ is changed, the color pattern changes, and the image of ⑦ is displayed (the color of the structural border ⑧ is also changed).
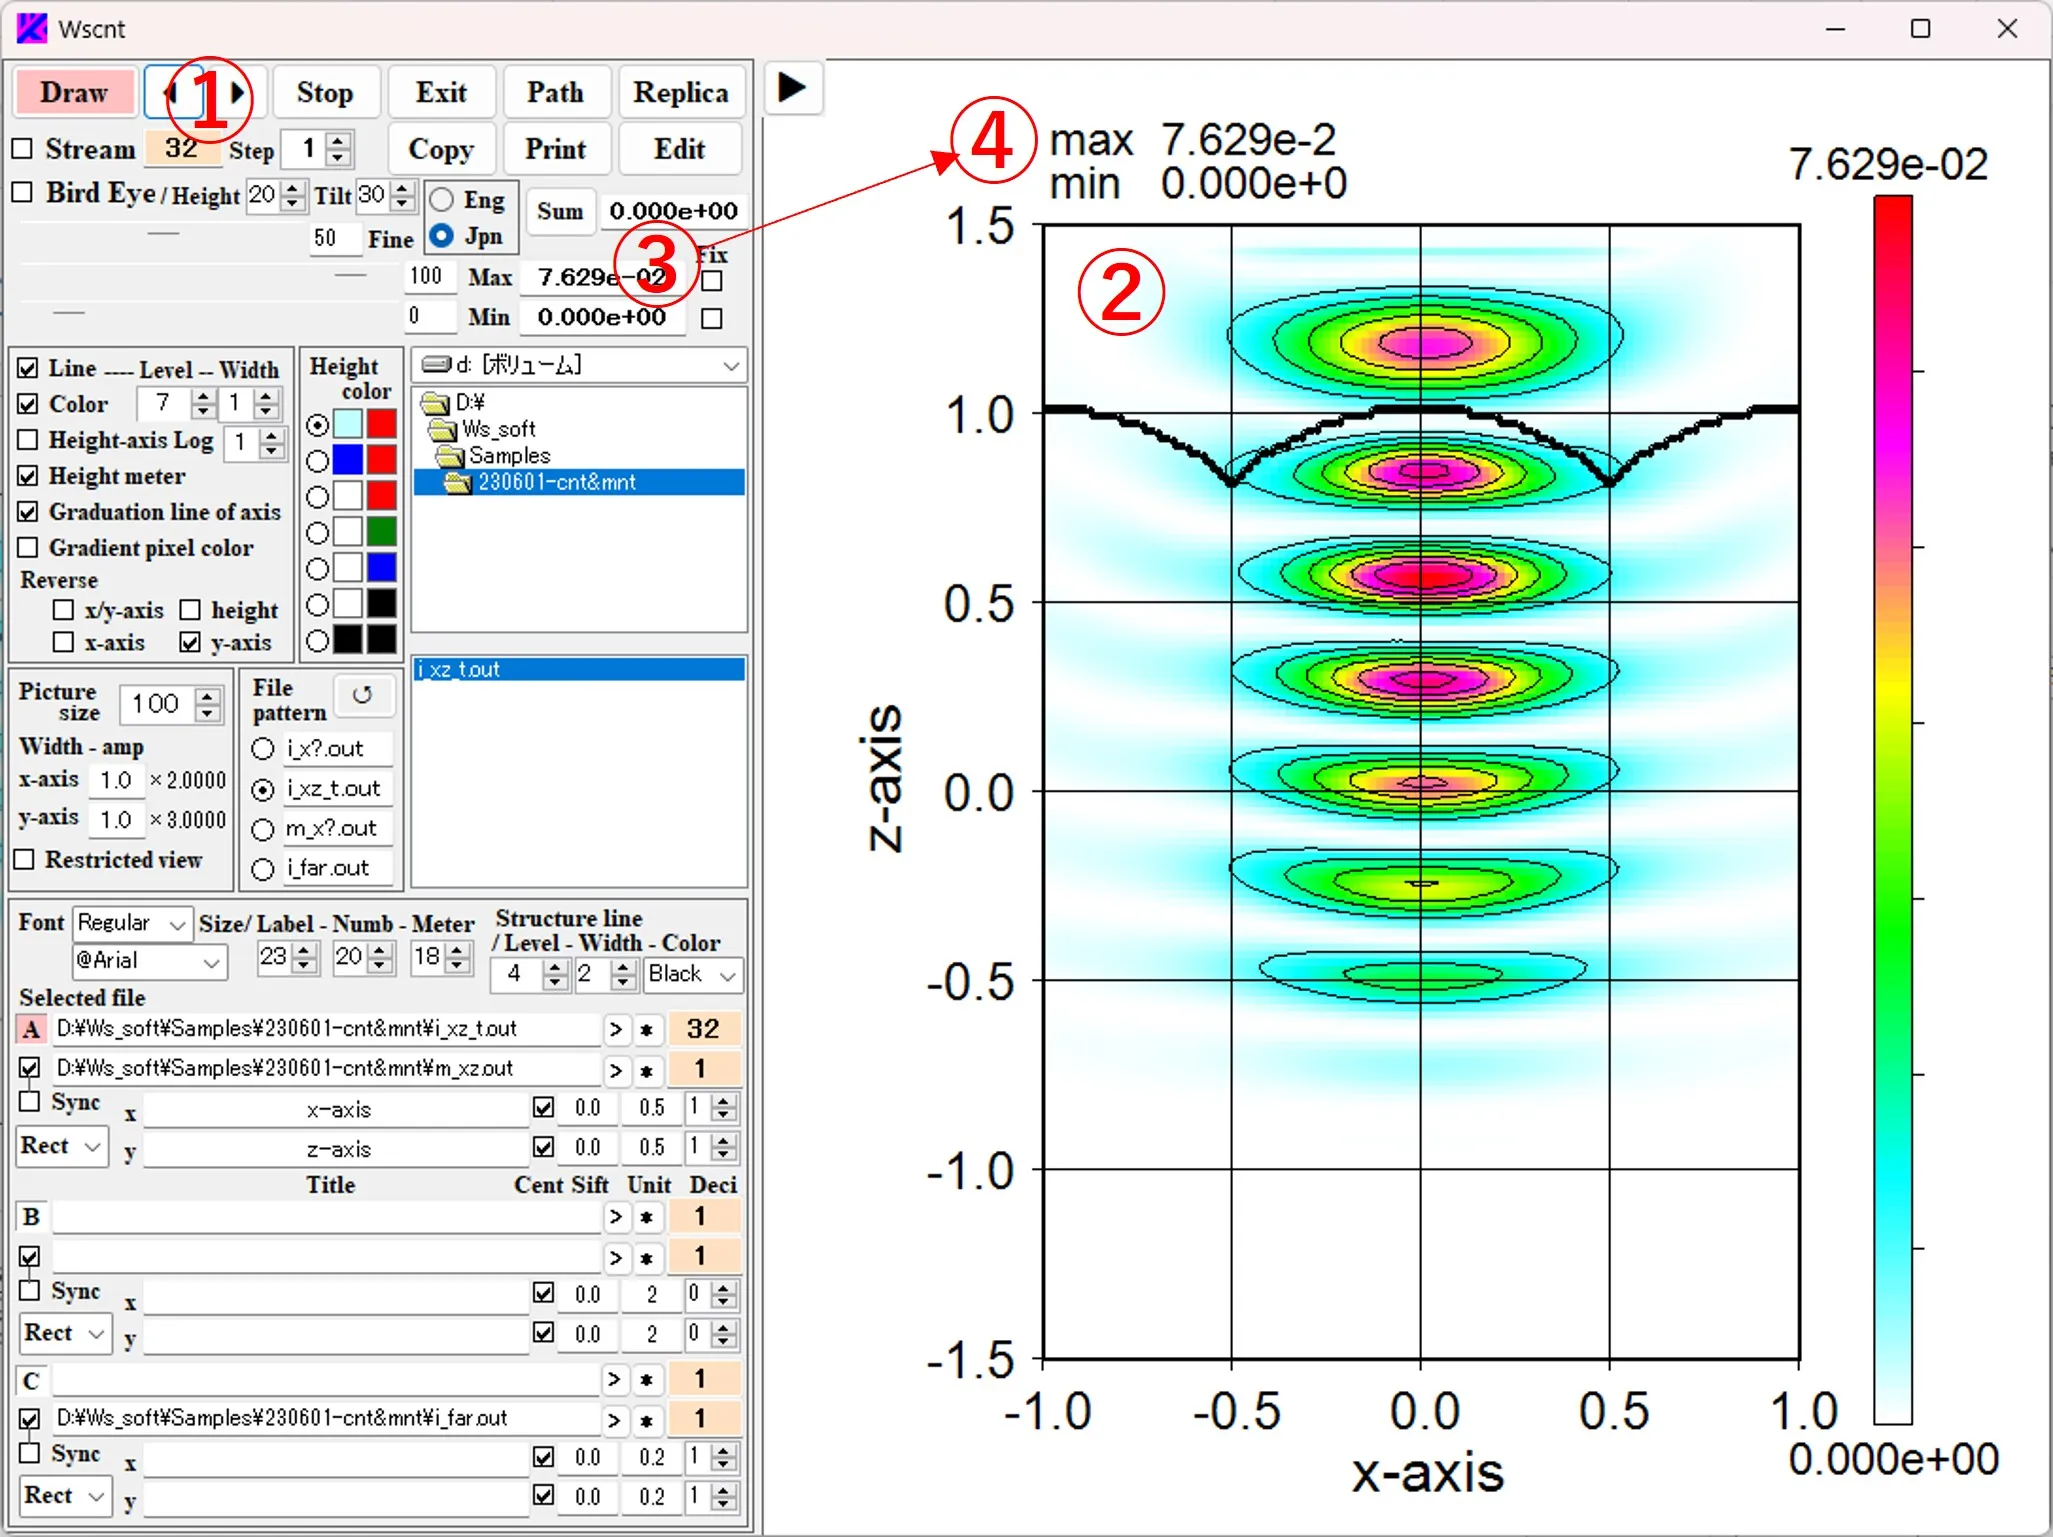
(5) When the contour image ② is displayed in any order ① of the data in the serial data, the maximum value and values (called the Local values) are displayed in the boxes ③, and the same value is also described in the upper left ④ of the drawing.
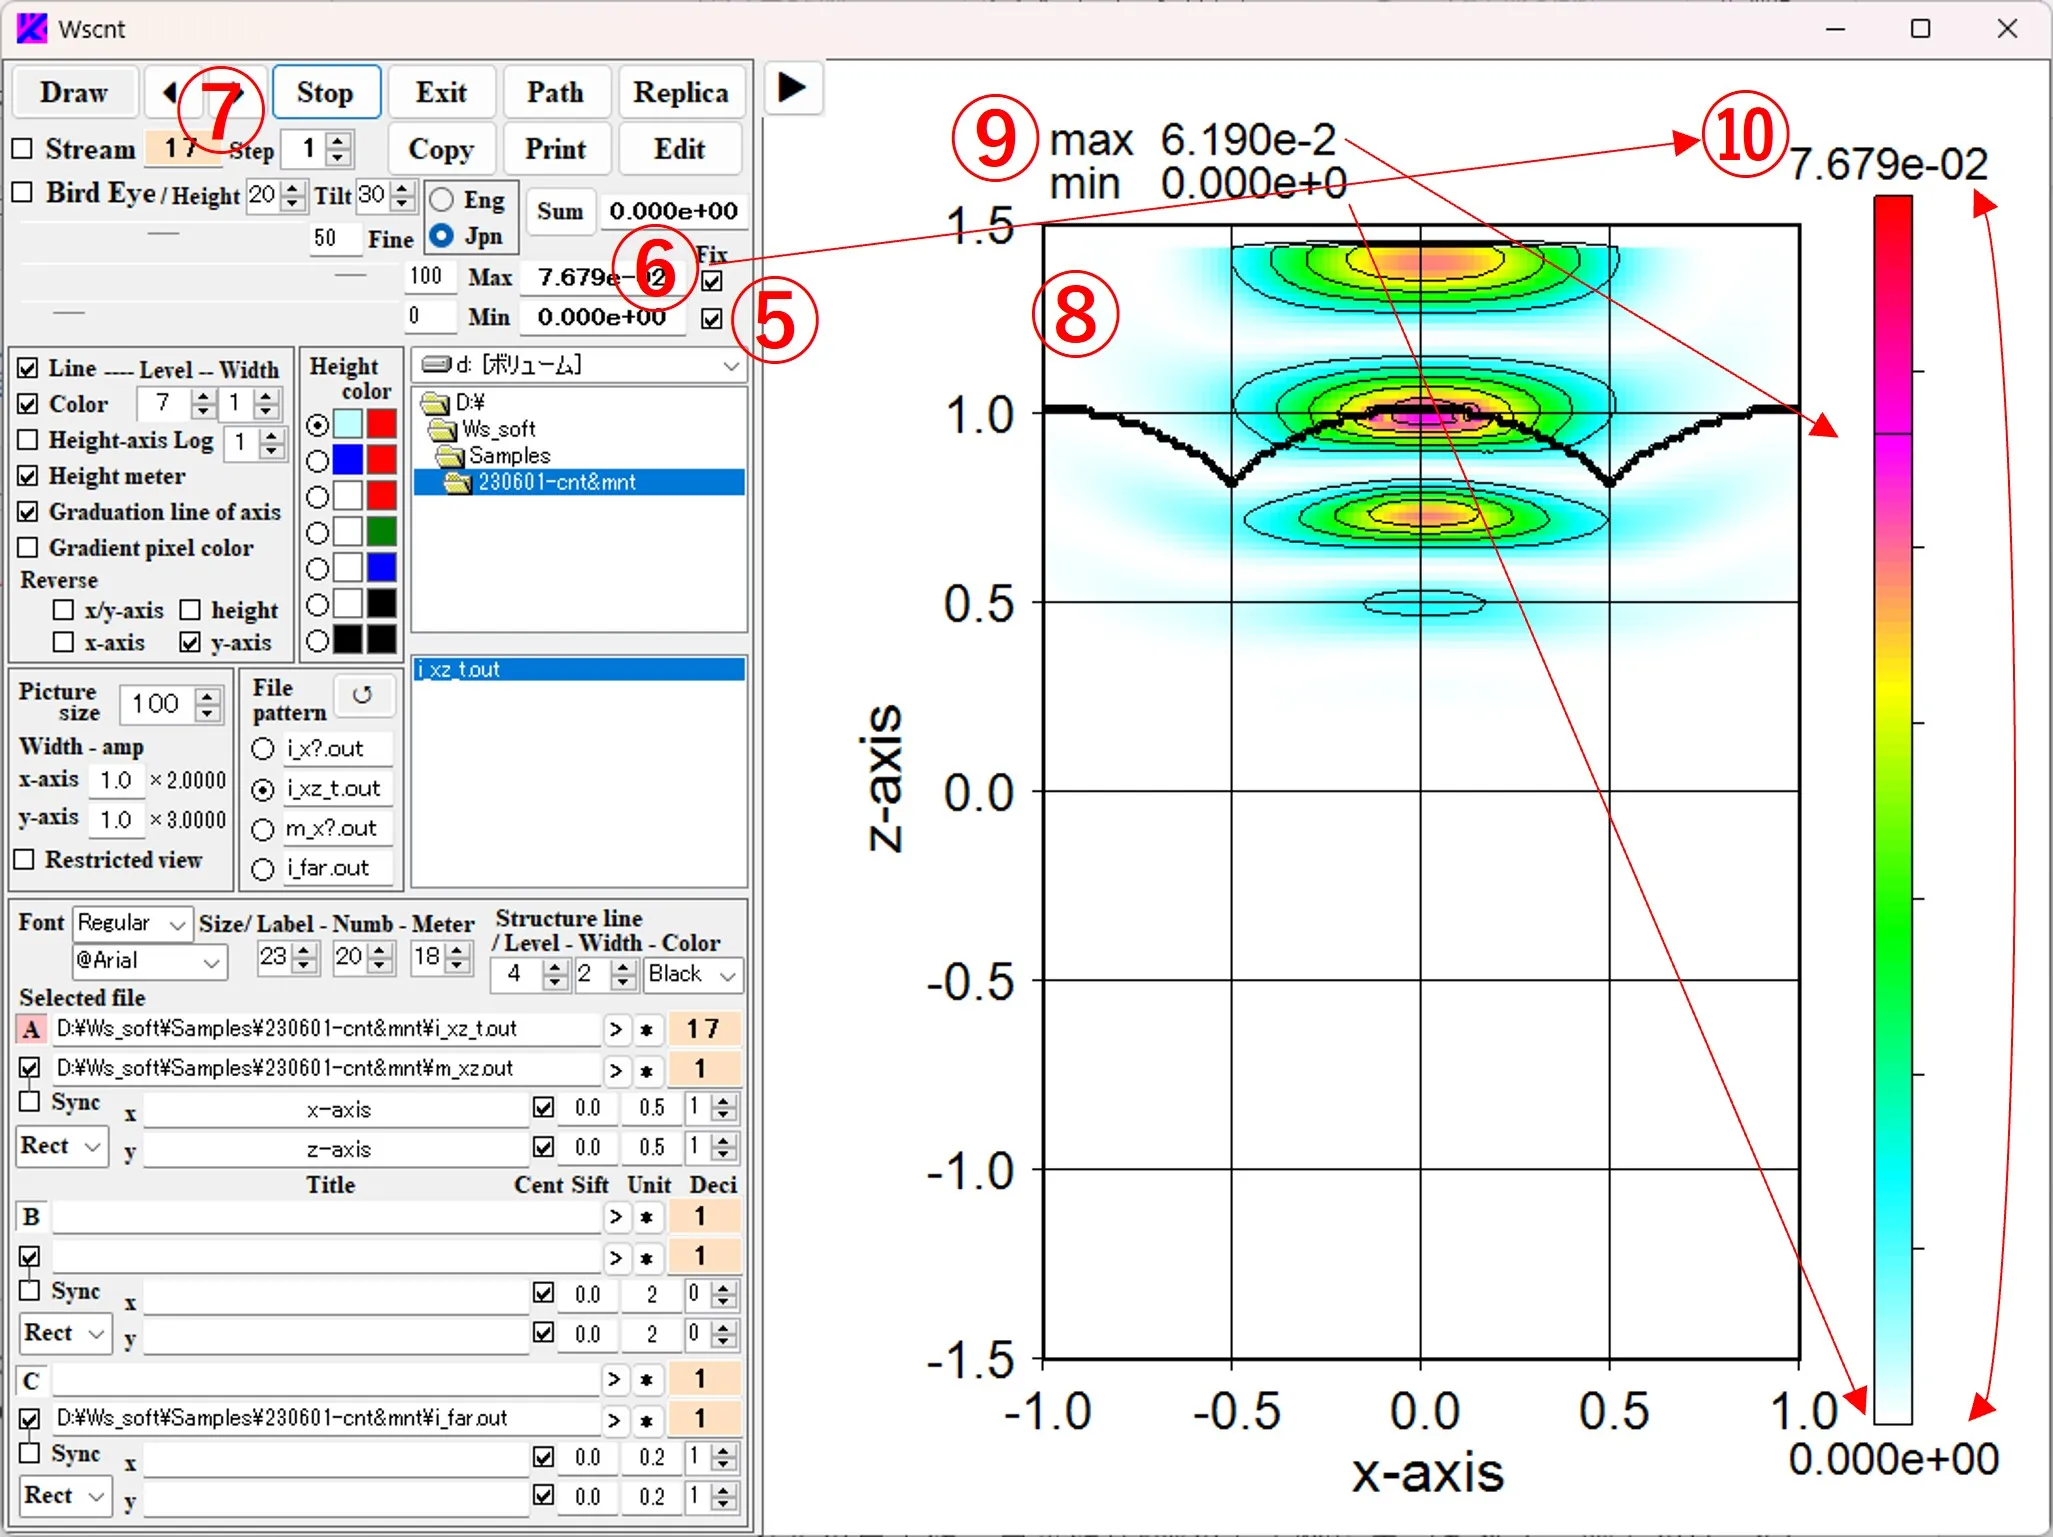
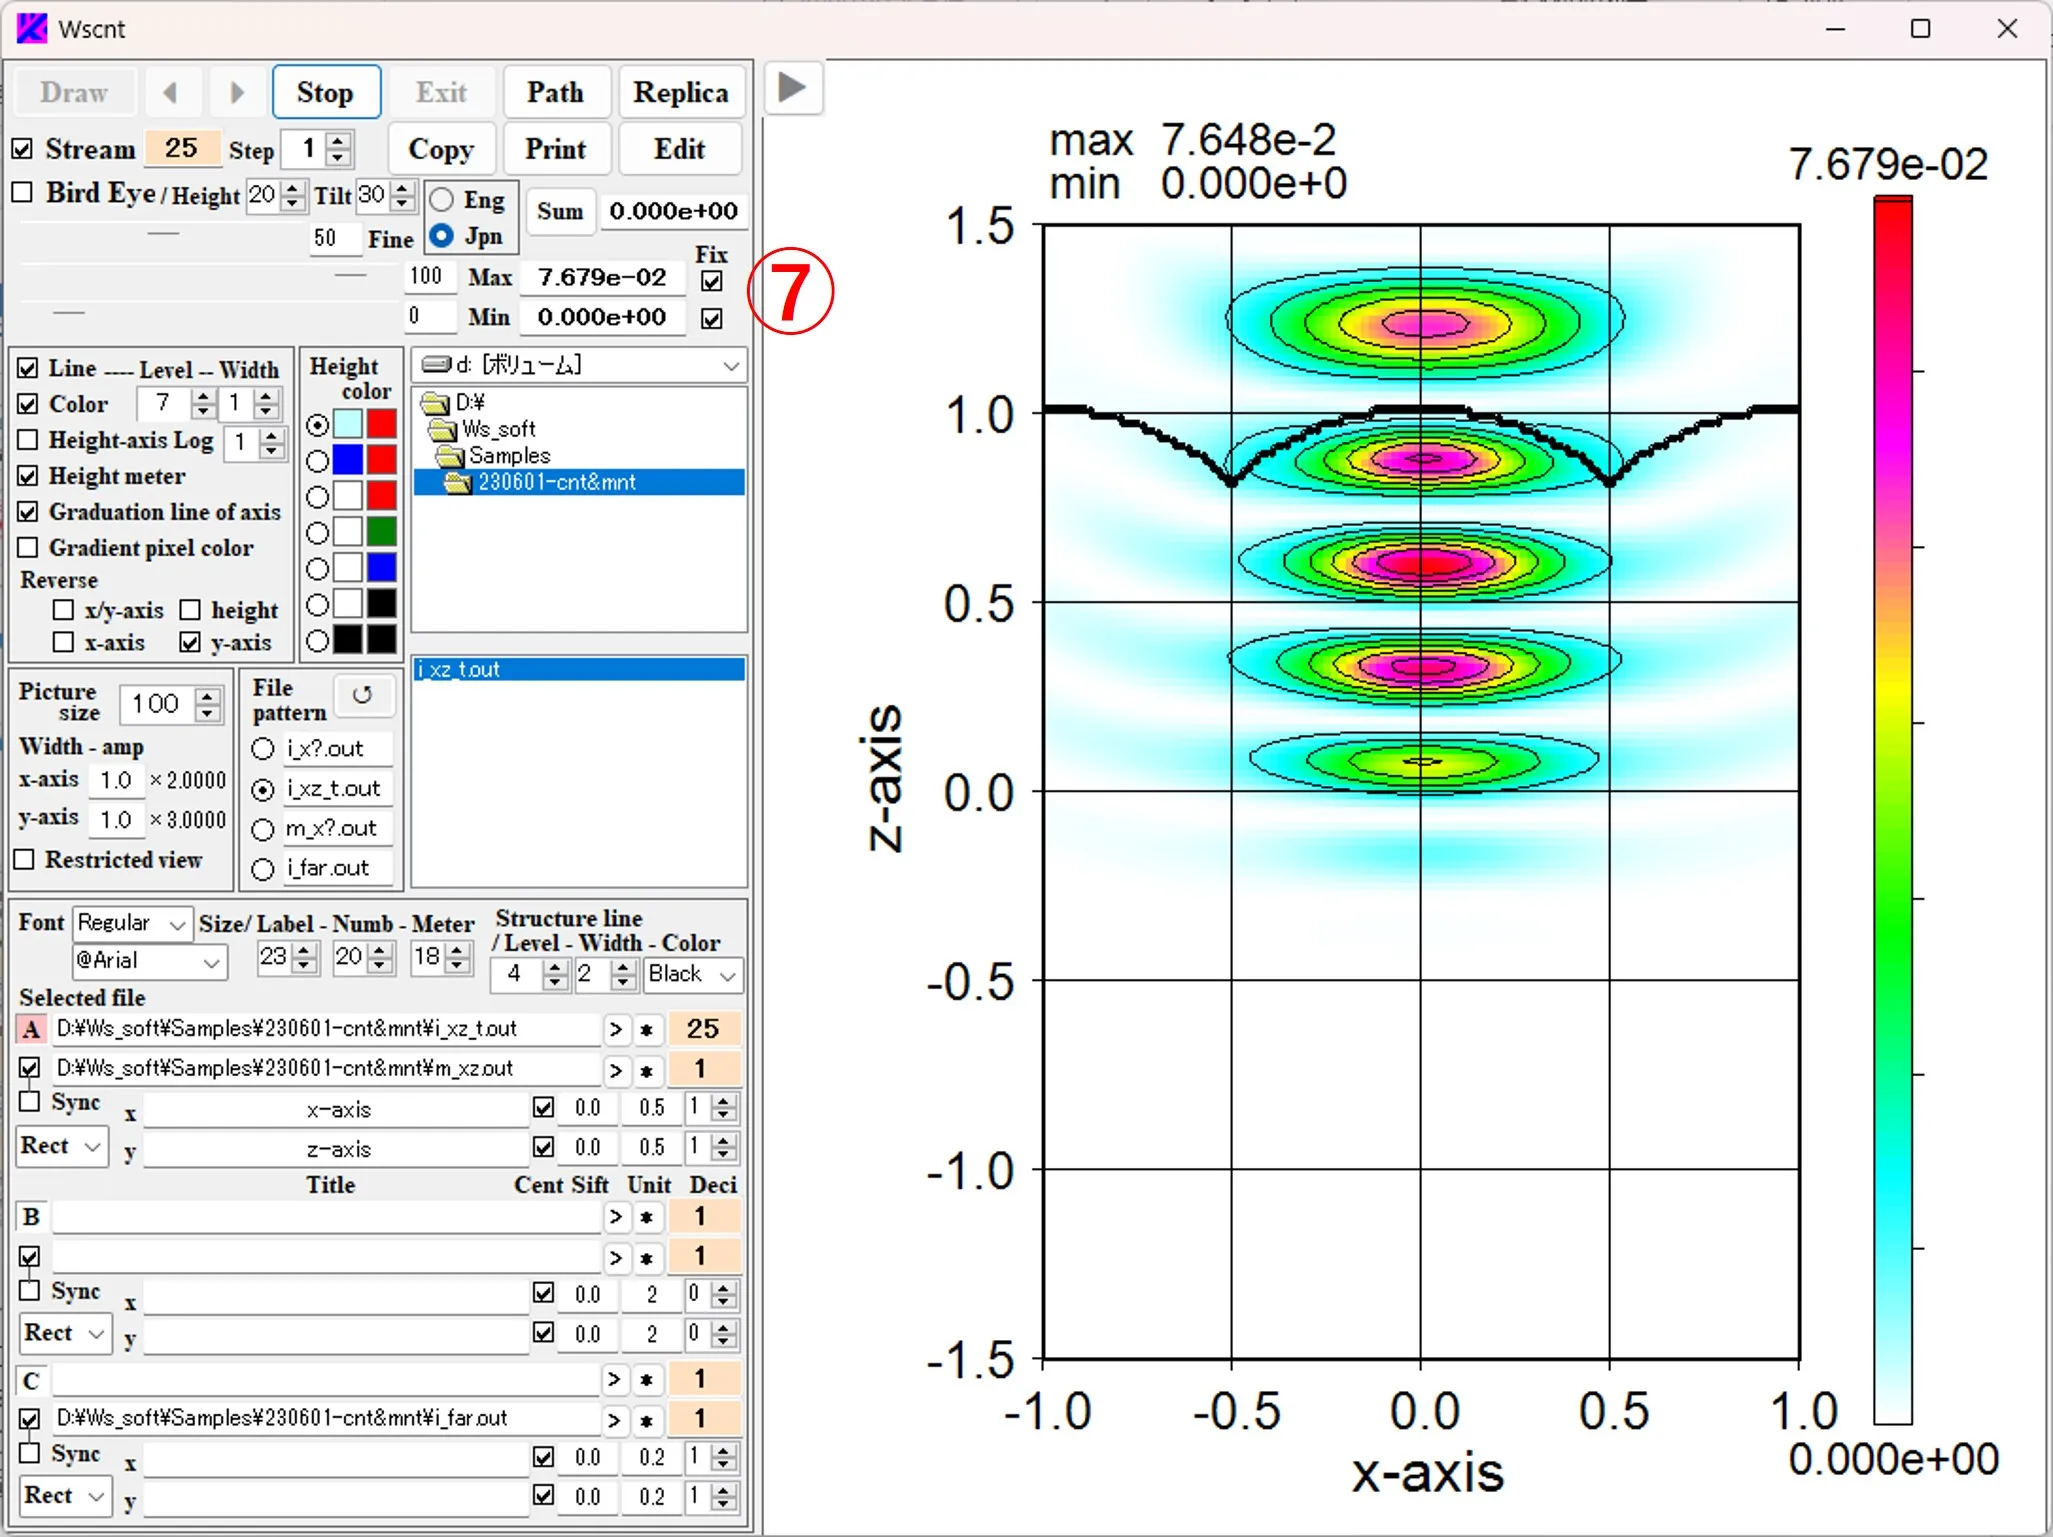
(6) When the Fix box ⑤ is checked, the maximum and minimum values are fixed to ⑥. When the order ⑦ of serial data is changed in this state, a contour image ⑧ represented by the color level of the fixed value ⑥ (called as the Global value) is displayed. The Local value (maximum and minimum values for the data of the displayed image) is displayed in the upper left ⑨ of the figure, and the Global value (maximum and minimum values of the color level) is expressed in the upper right ⑩ of the figure. In the Height meter on the right side of the figure, the Global value is indicated by the top and bottom edges, and the Local value is indicated by a black horizontal line.
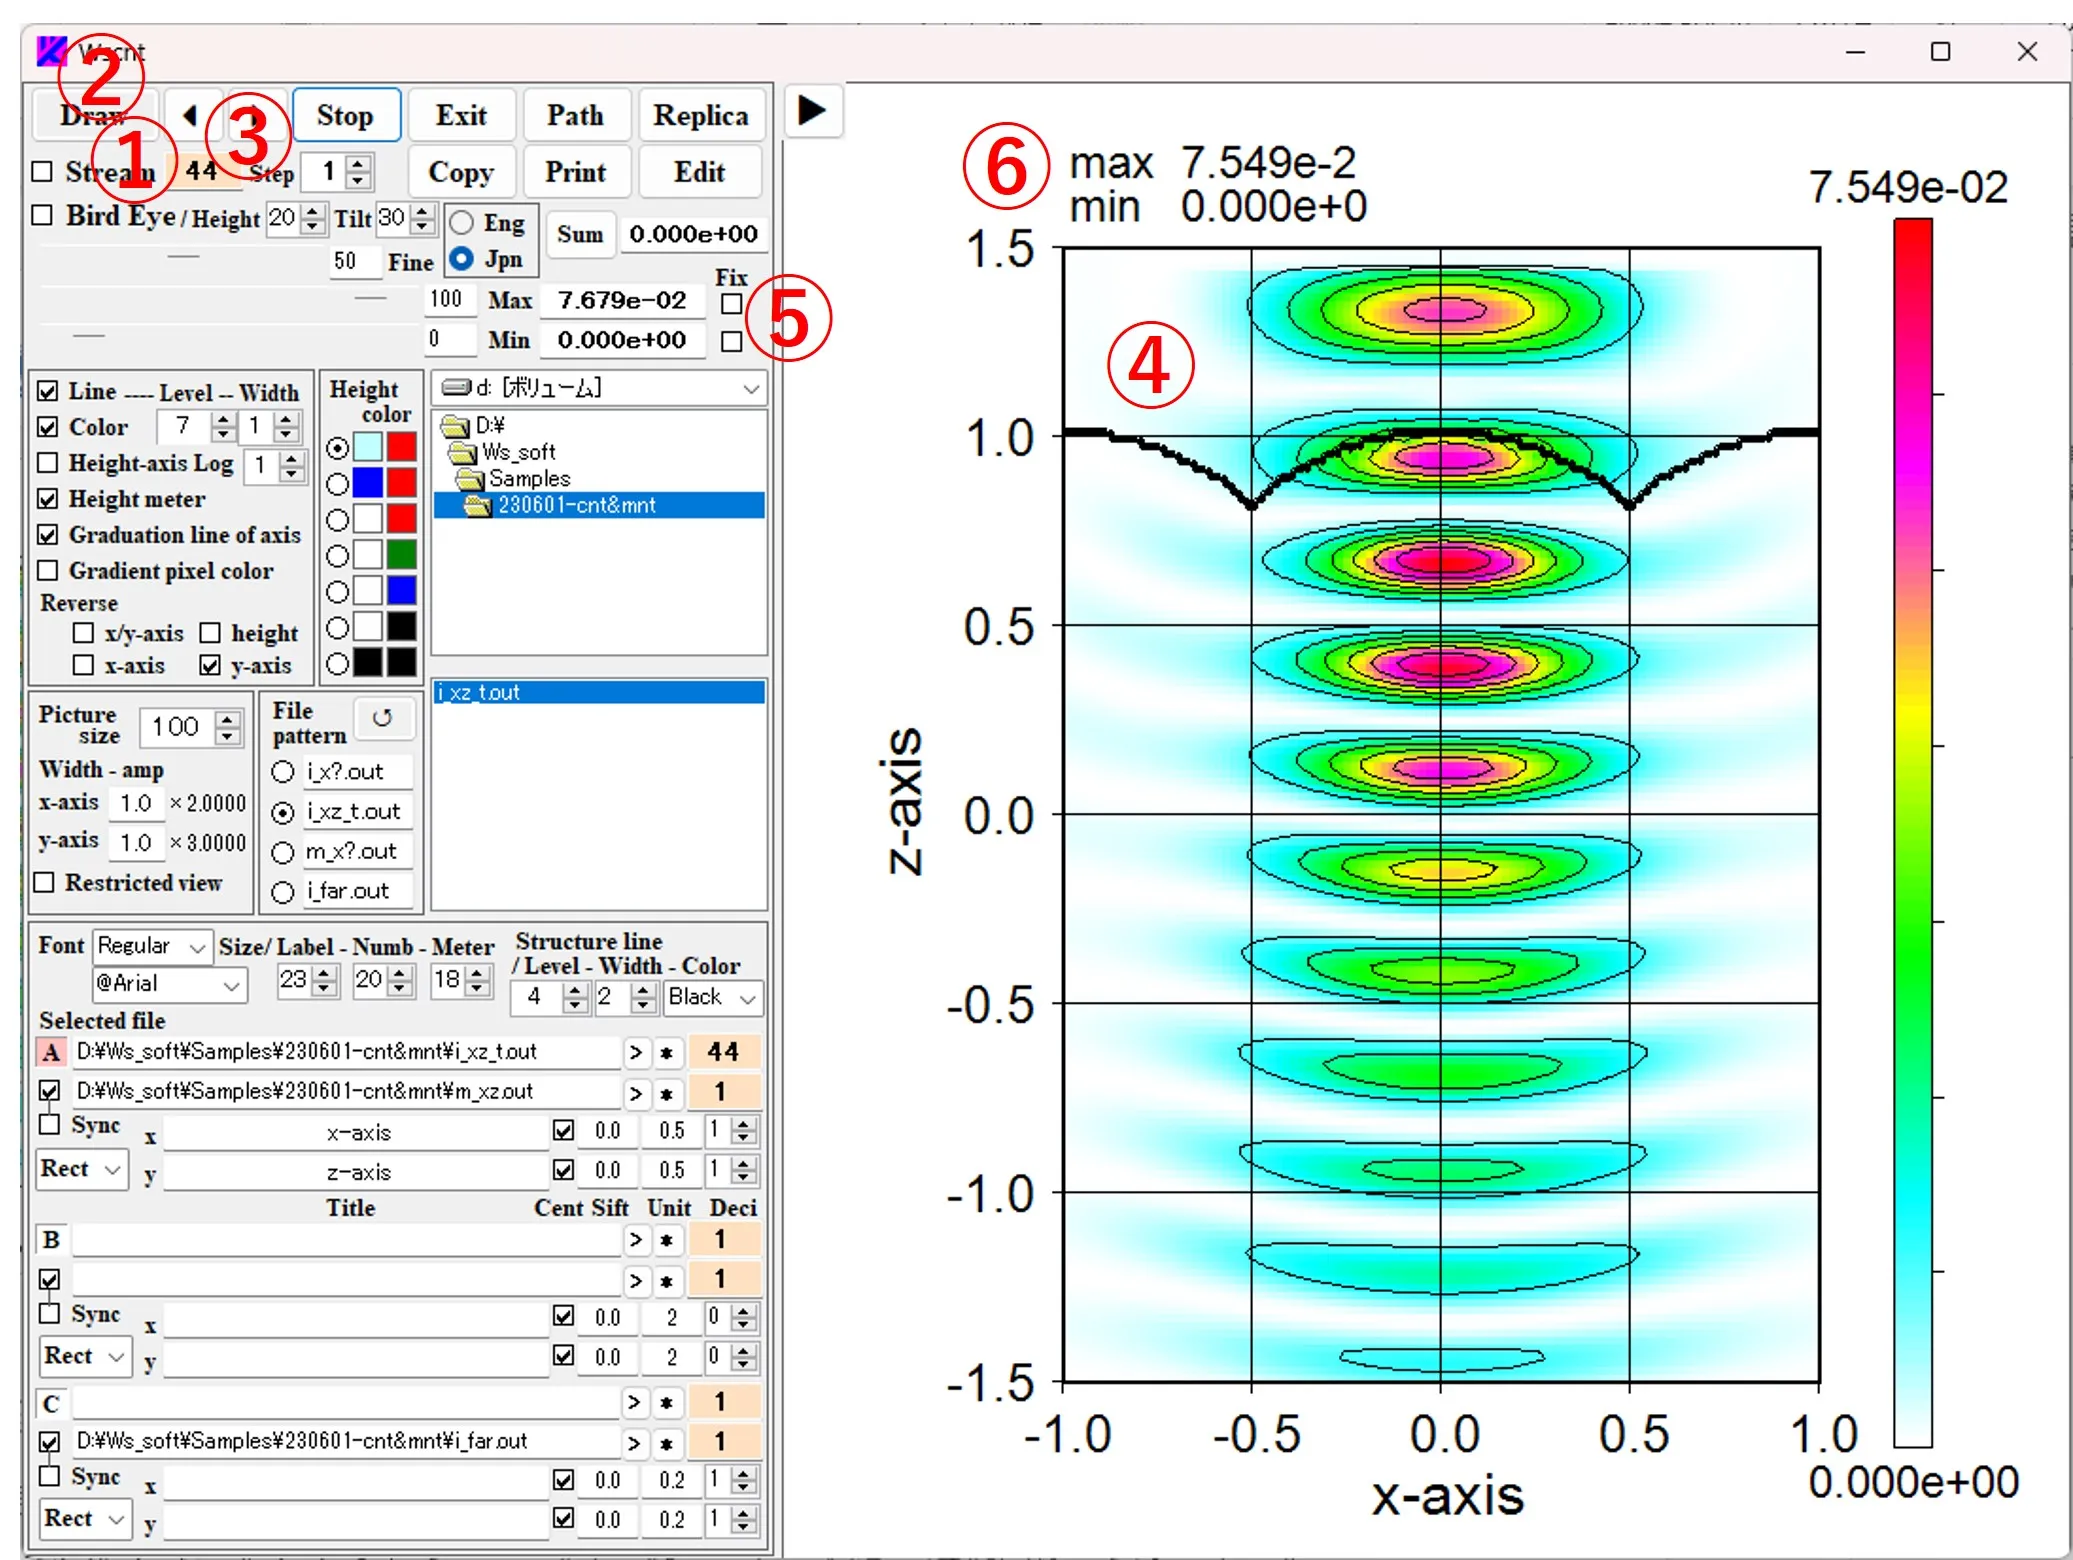
(7) Movie manipulation and unification of intensity scale: Check the Stream box ①, set the value of box ③ to 1, and click the Draw button ② to display the serial data images ④ in order, and the box ⑤ displays the maximum and minimum values through all the data. The upper left ⑥ of the figure is the maximum value and the minimum value (that is, the Local value) of the final image data. After the serial image drawing is completed, check the Fix box ⑦ to return the box ③ to the starting point, check the Stream box ① and click the Draw button ②. A serial images are displayed with the intensity scale unified at a fixed value (maximum value and minimum value in serial data, i.e., Global value).
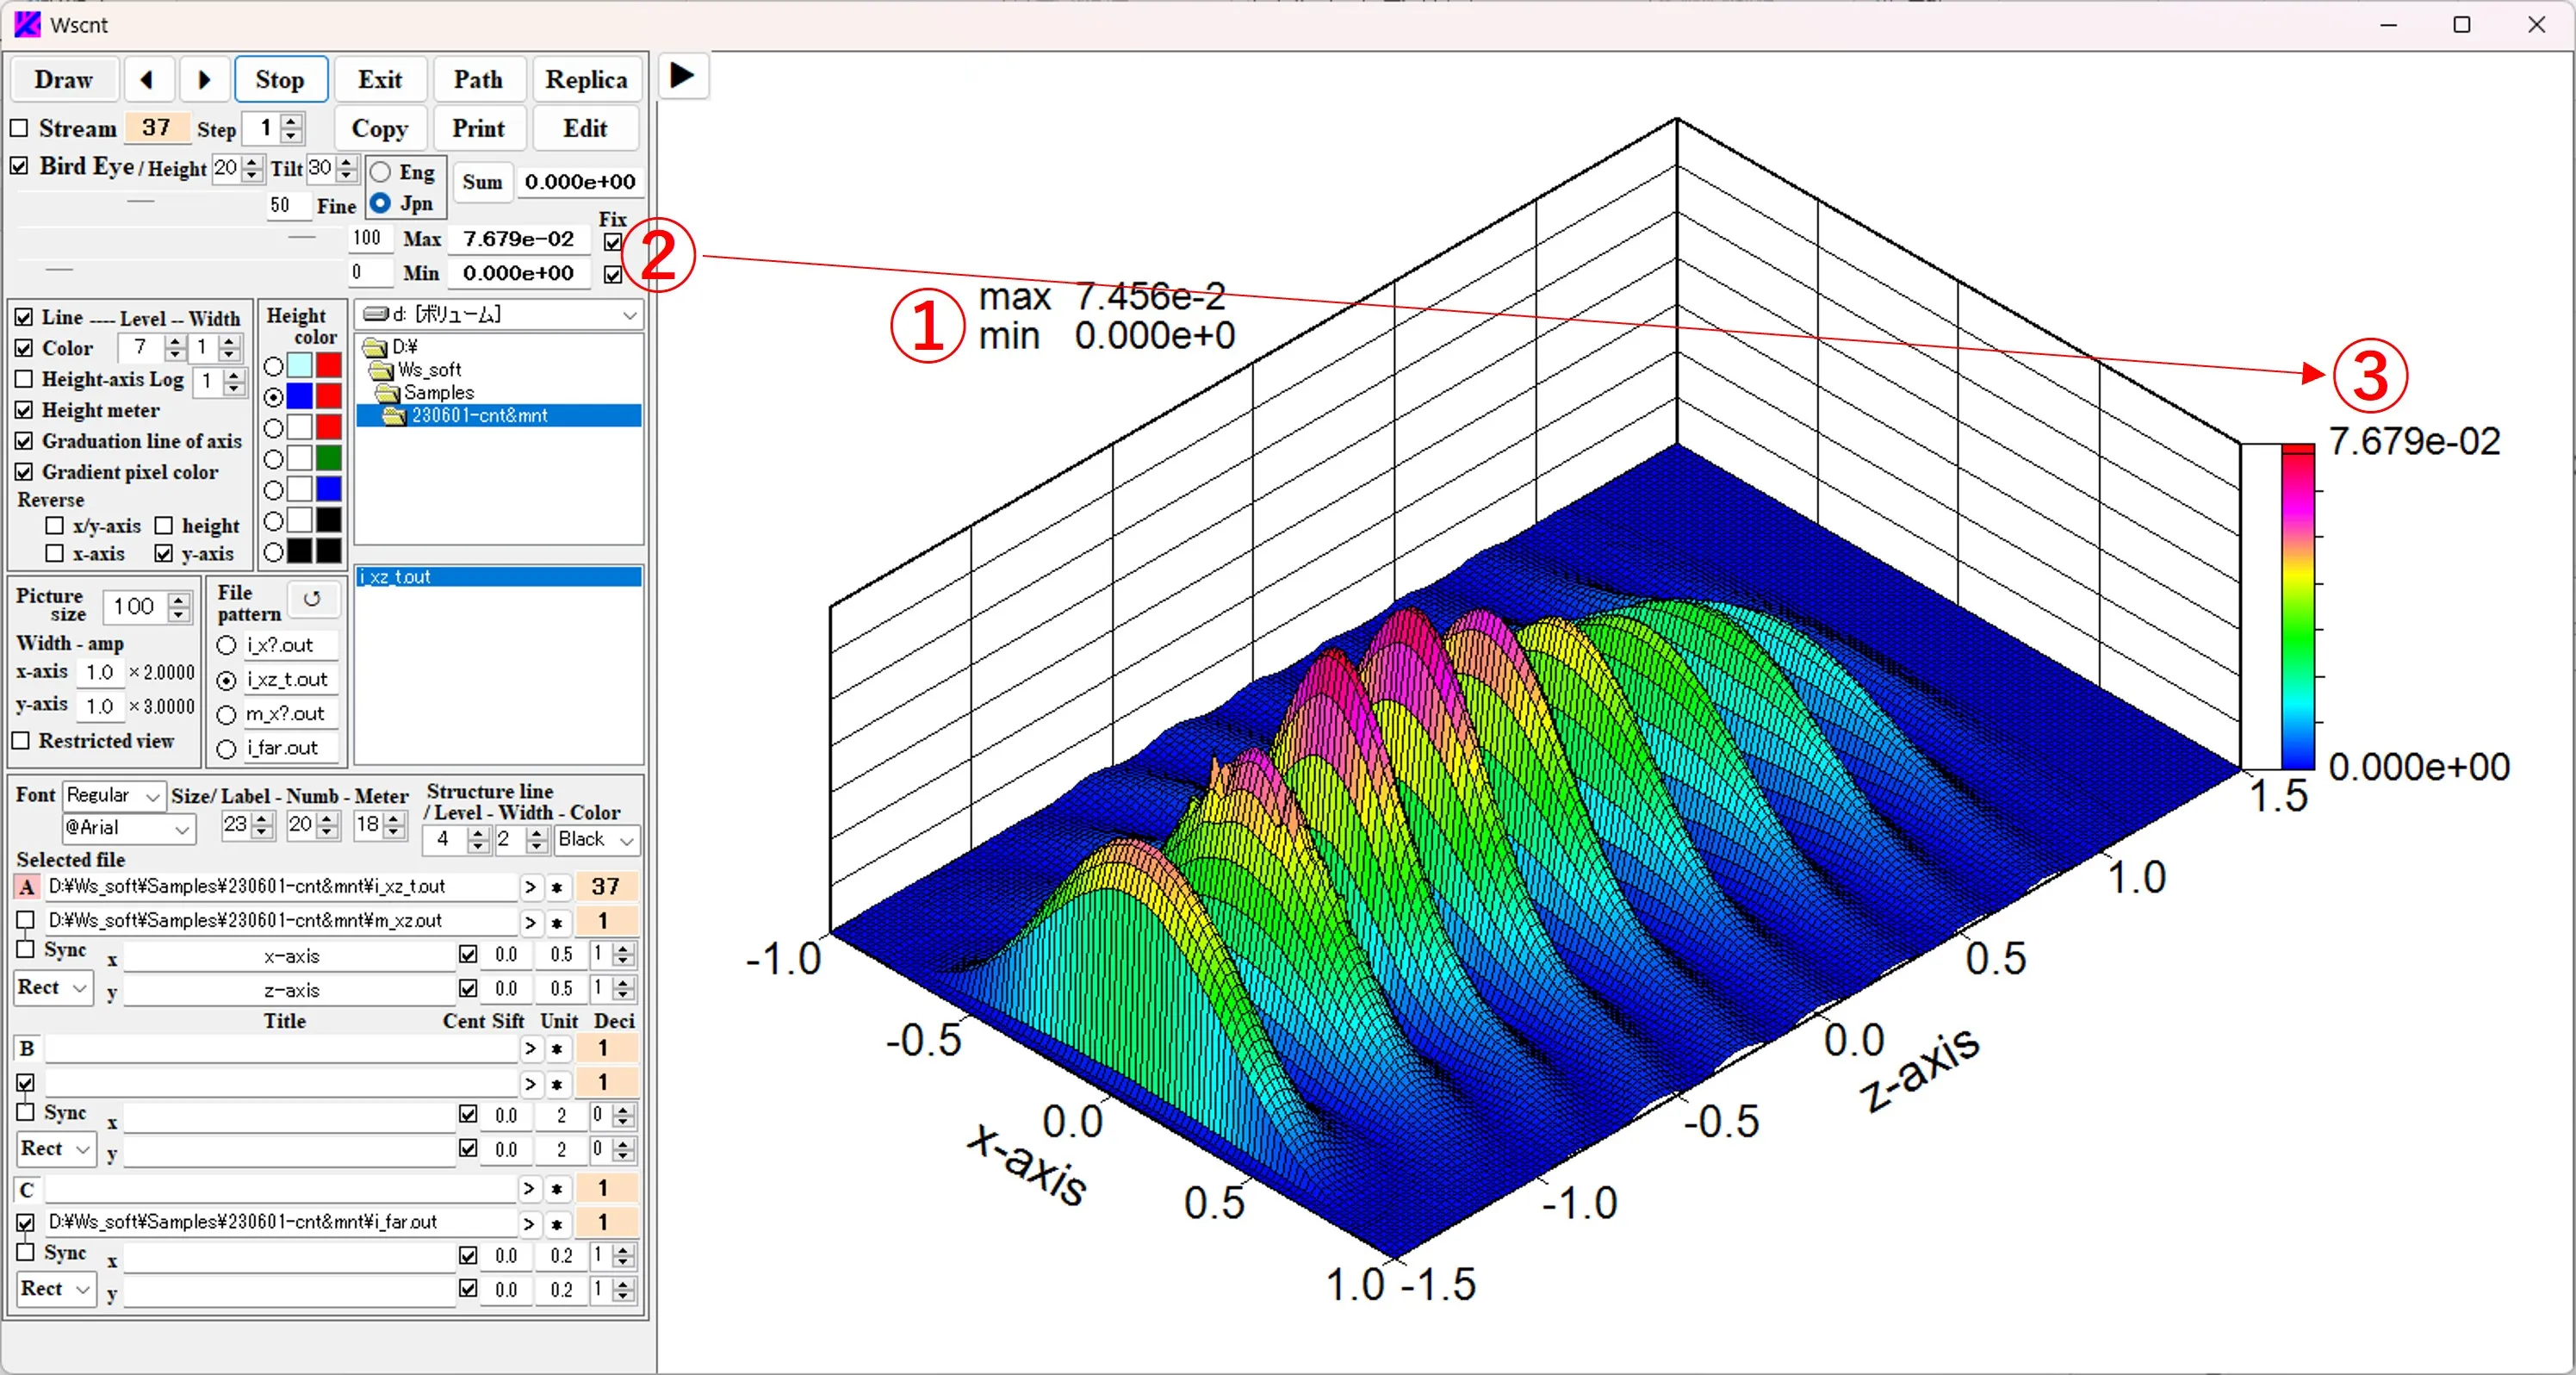
(8) Maximum and minimum values of bird's eye images: In the case of a bird's eye image, the maximum and minimum values of the currently displayed image data are shown in the upper left ① of the figure, and the fixed value ② is displayed above and below the height meter ③ in the figure.
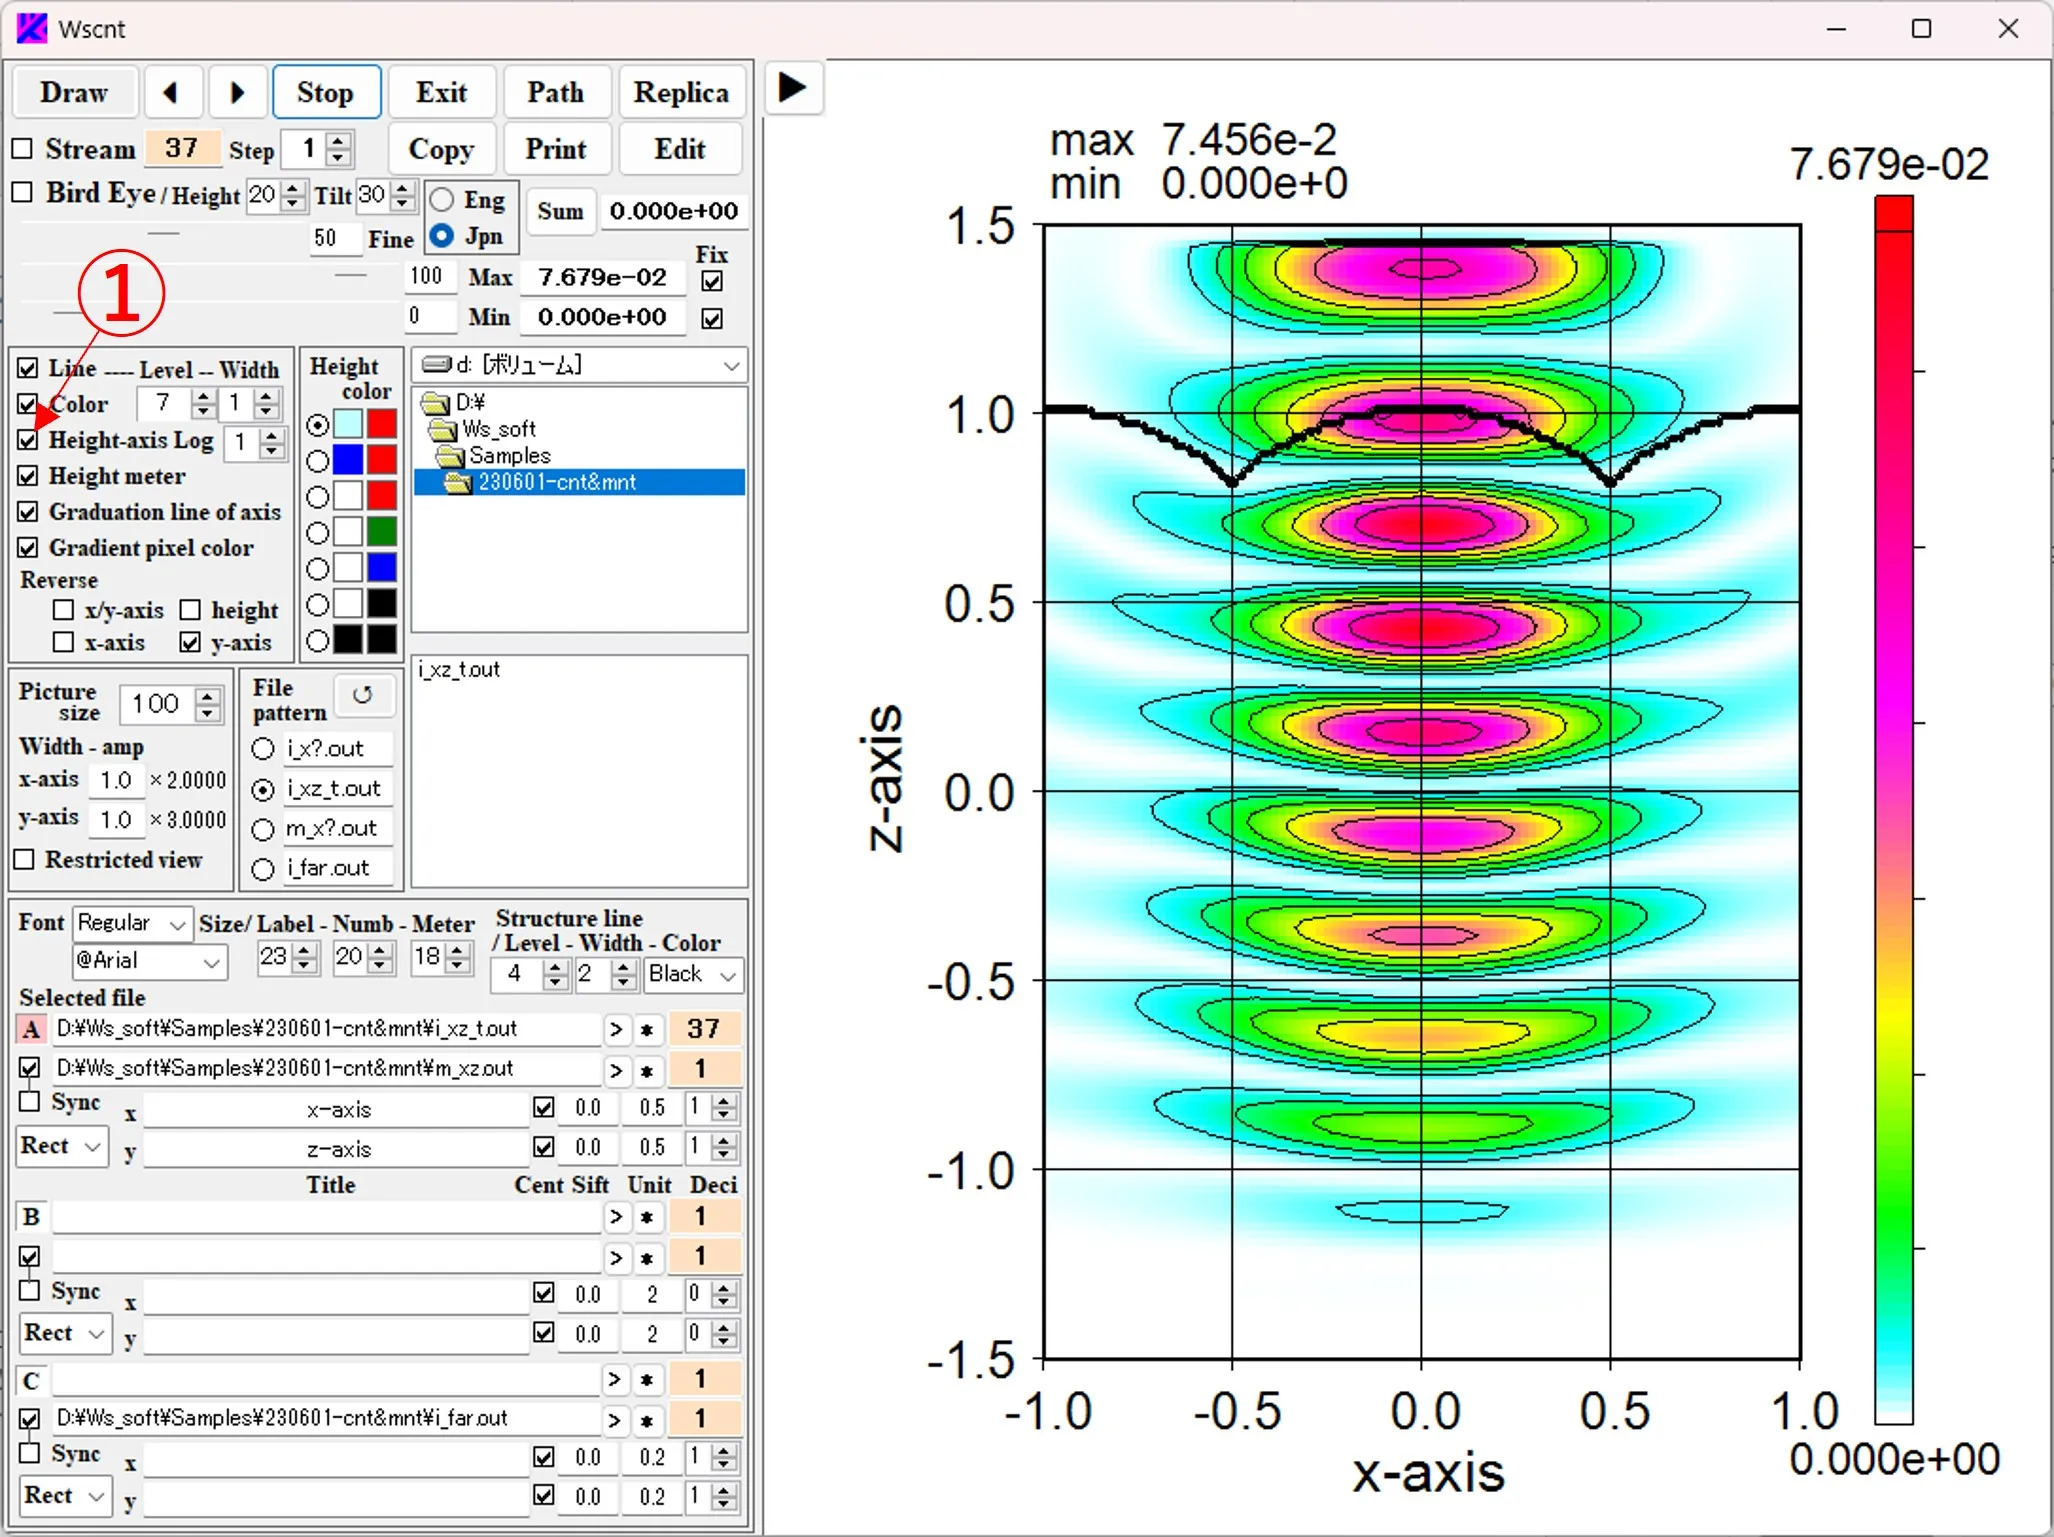
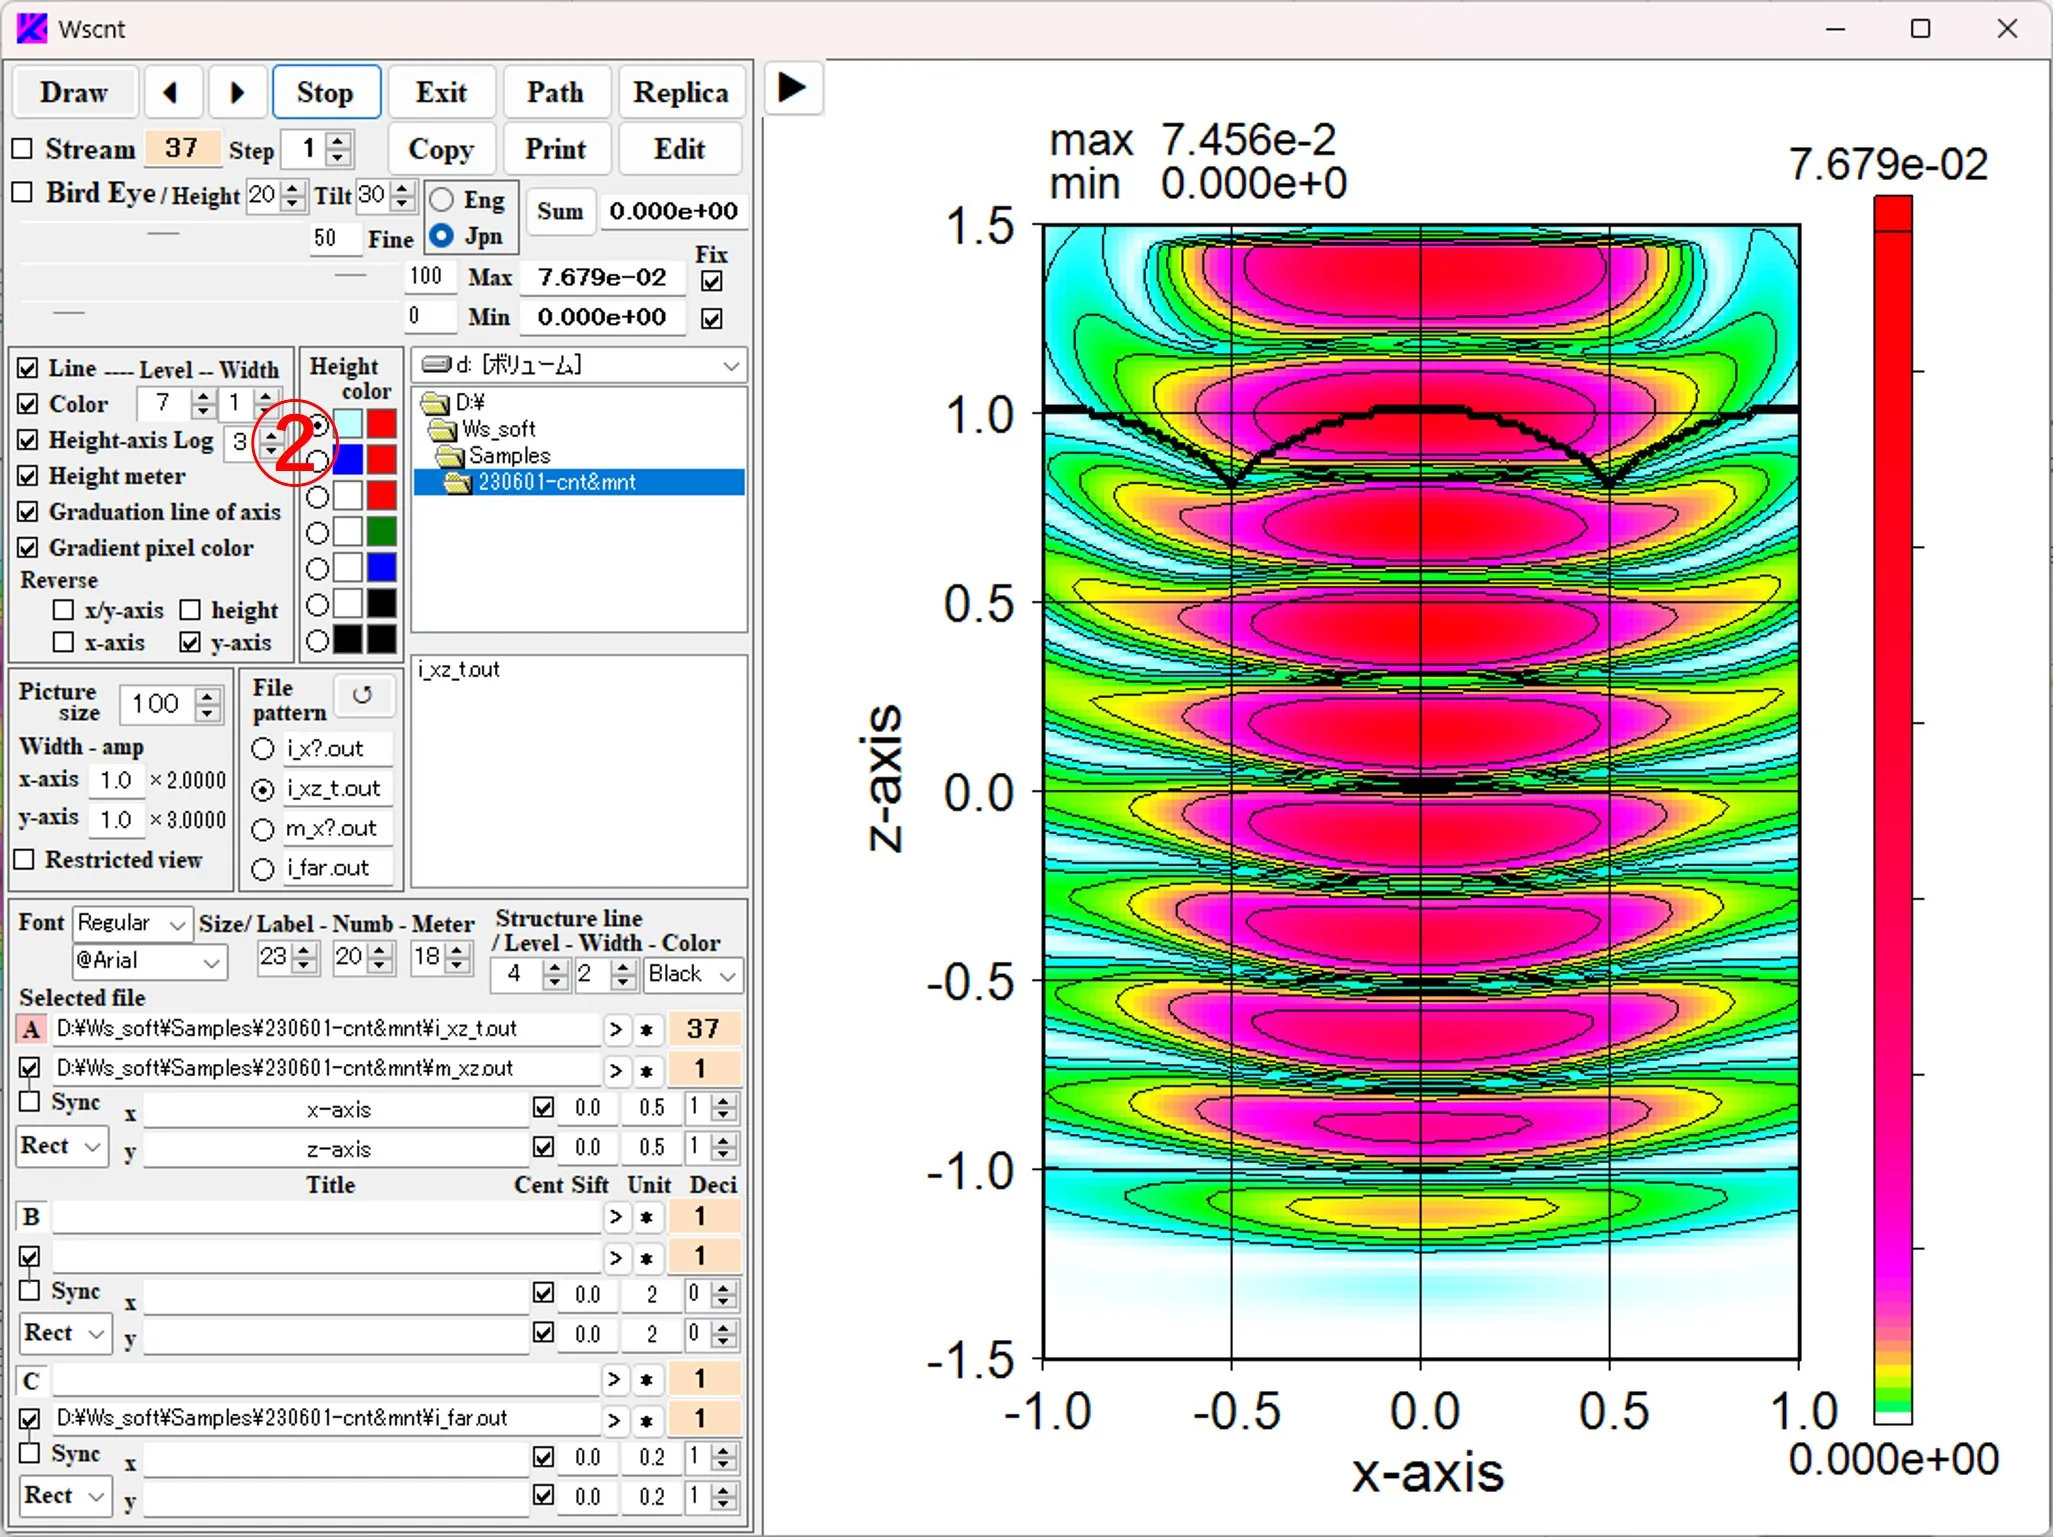
(9) Log setting of height scale: Check the box ① to change the height scale of the contour line from the linear scale to the log scale. The box ② is the exponent n of the Log scale (z' = n* log10 (9 * (z-zmin) / (zmax-zmin) + 1)), and the larger it is, the more emphasis is on the low frequency of intensity.
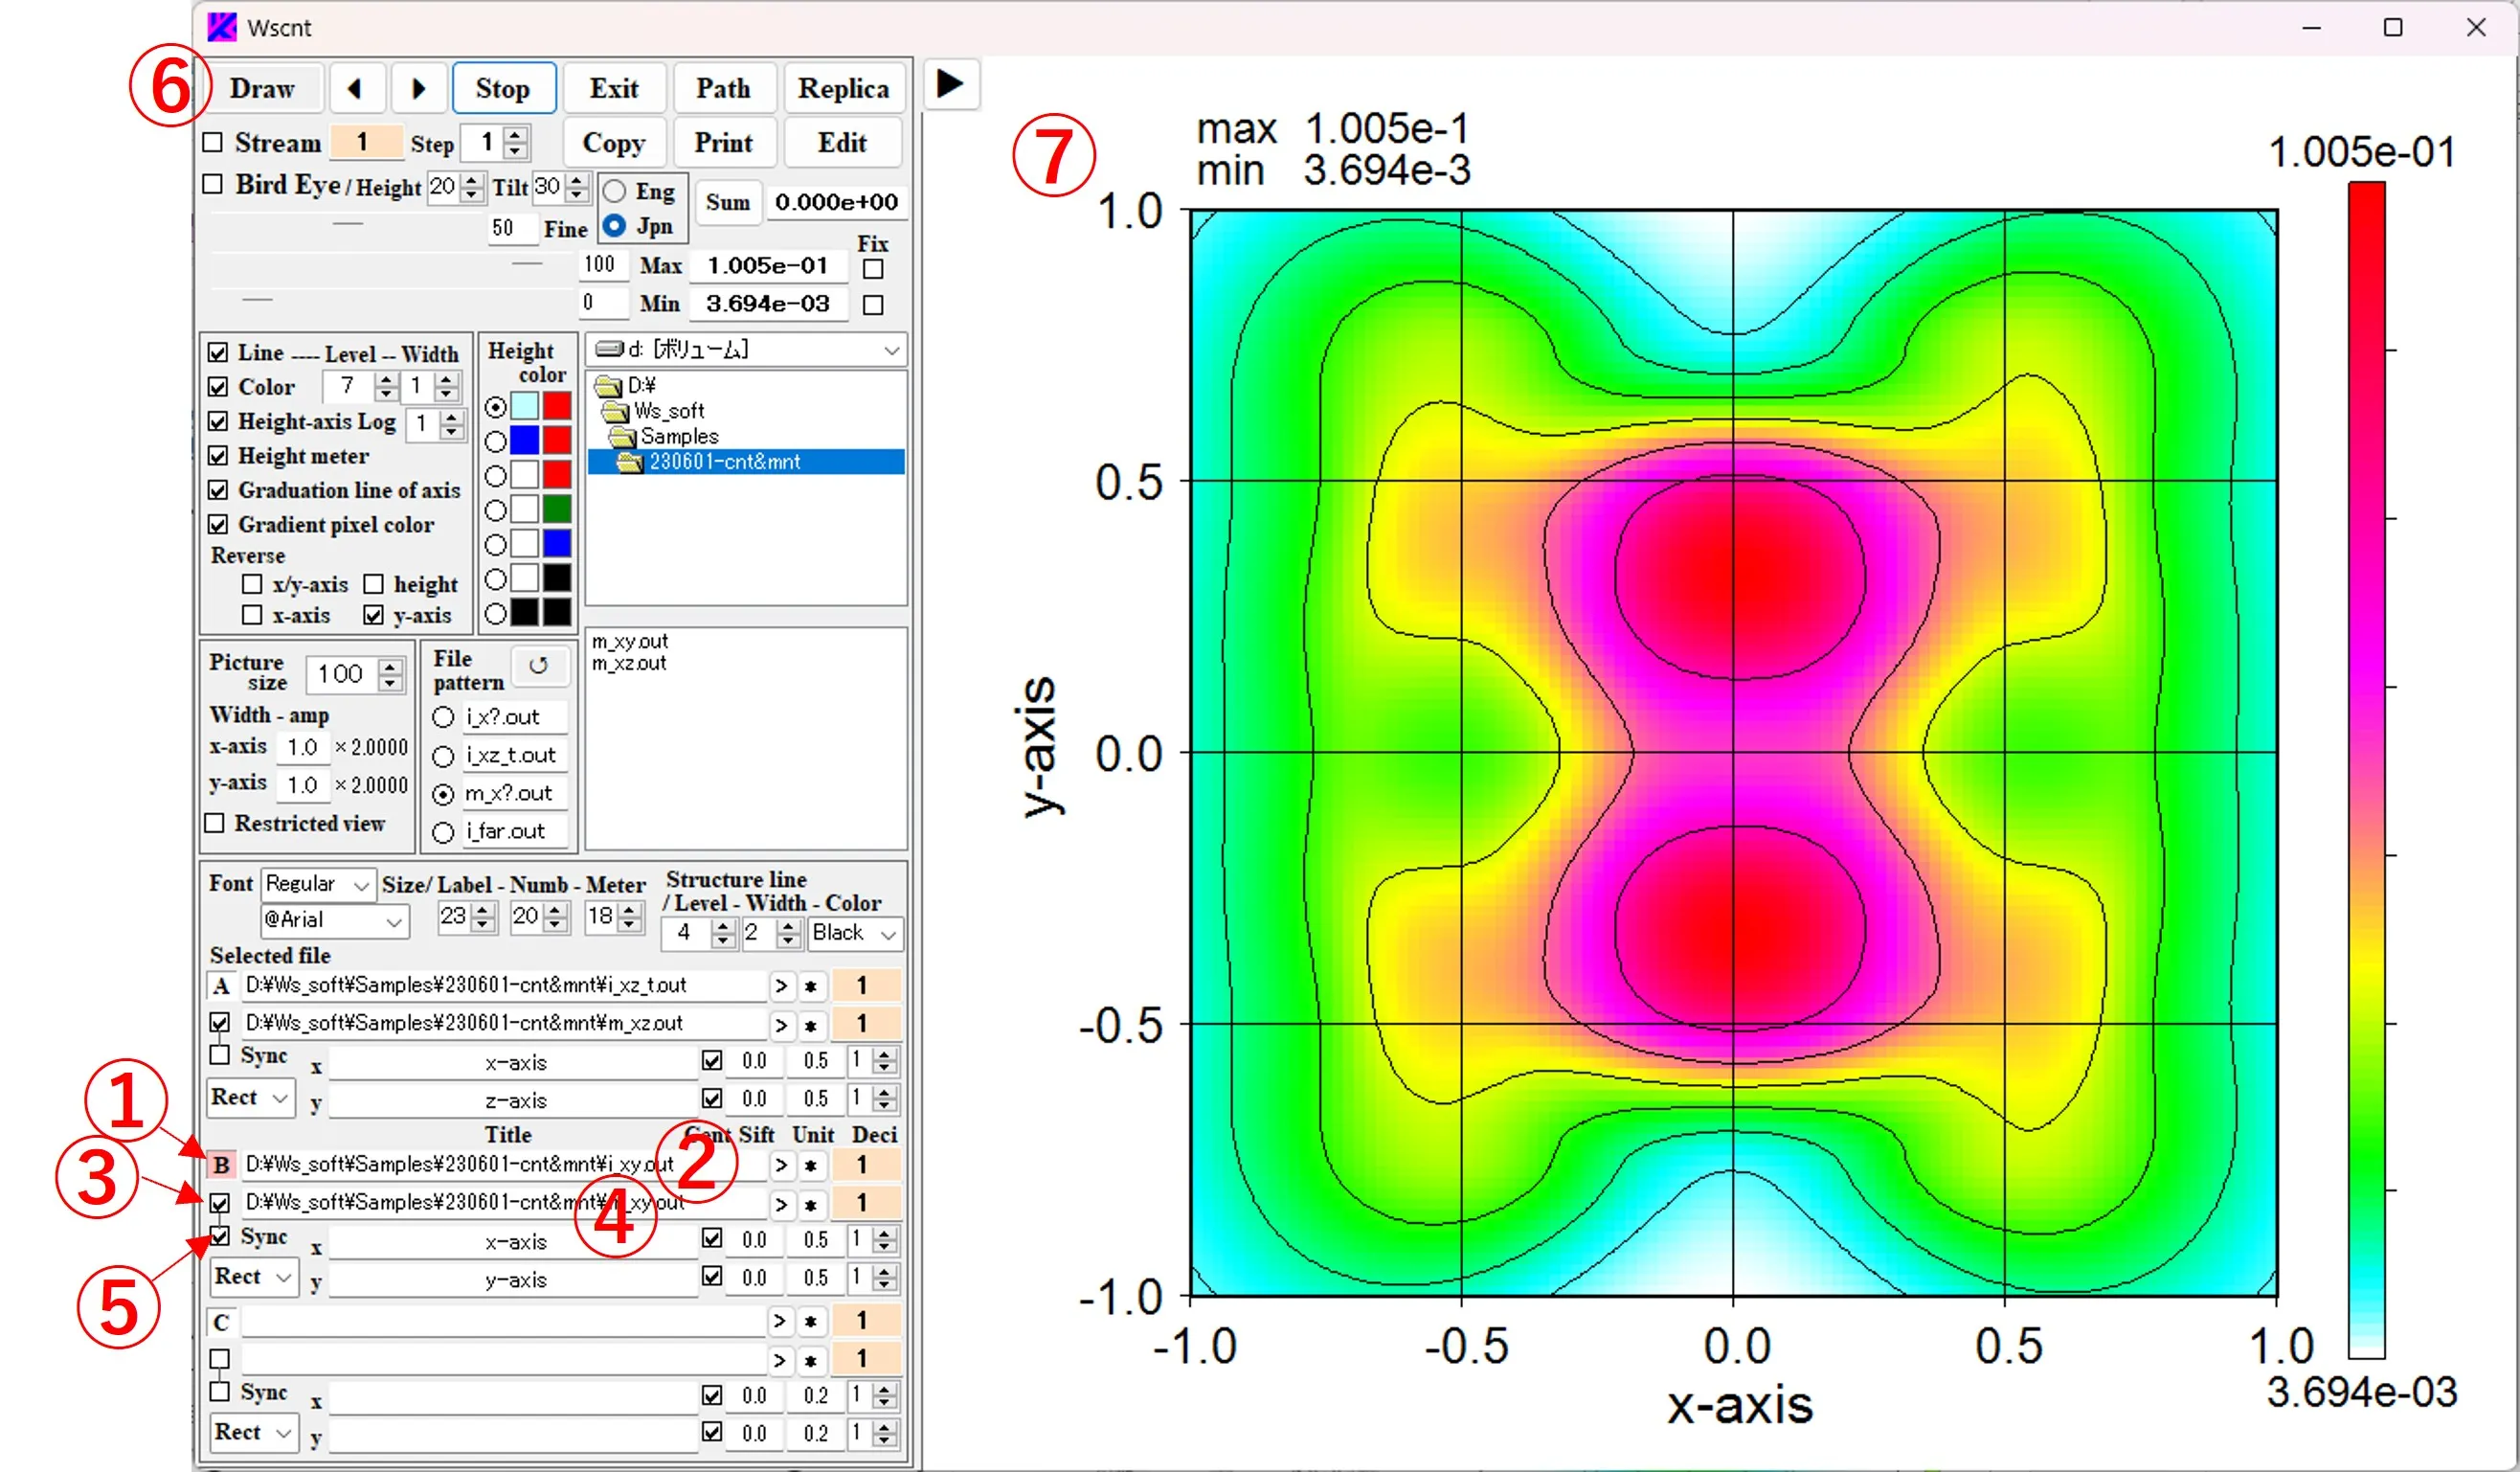
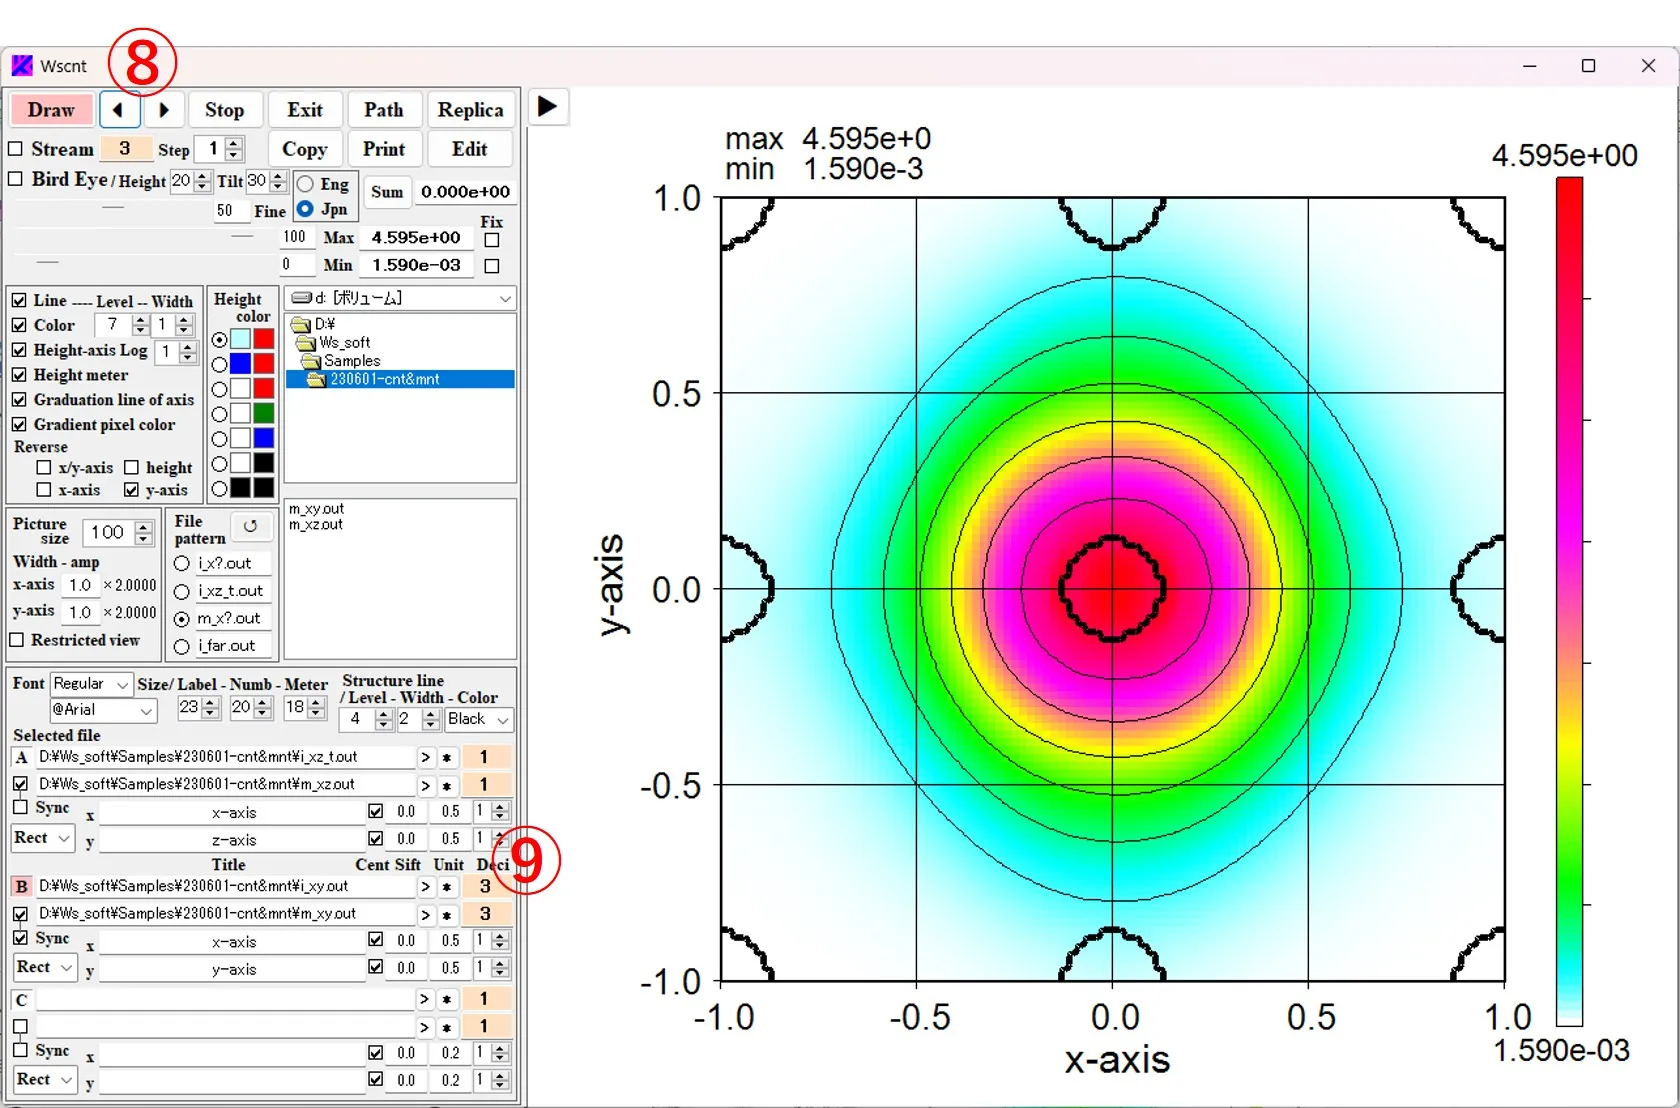
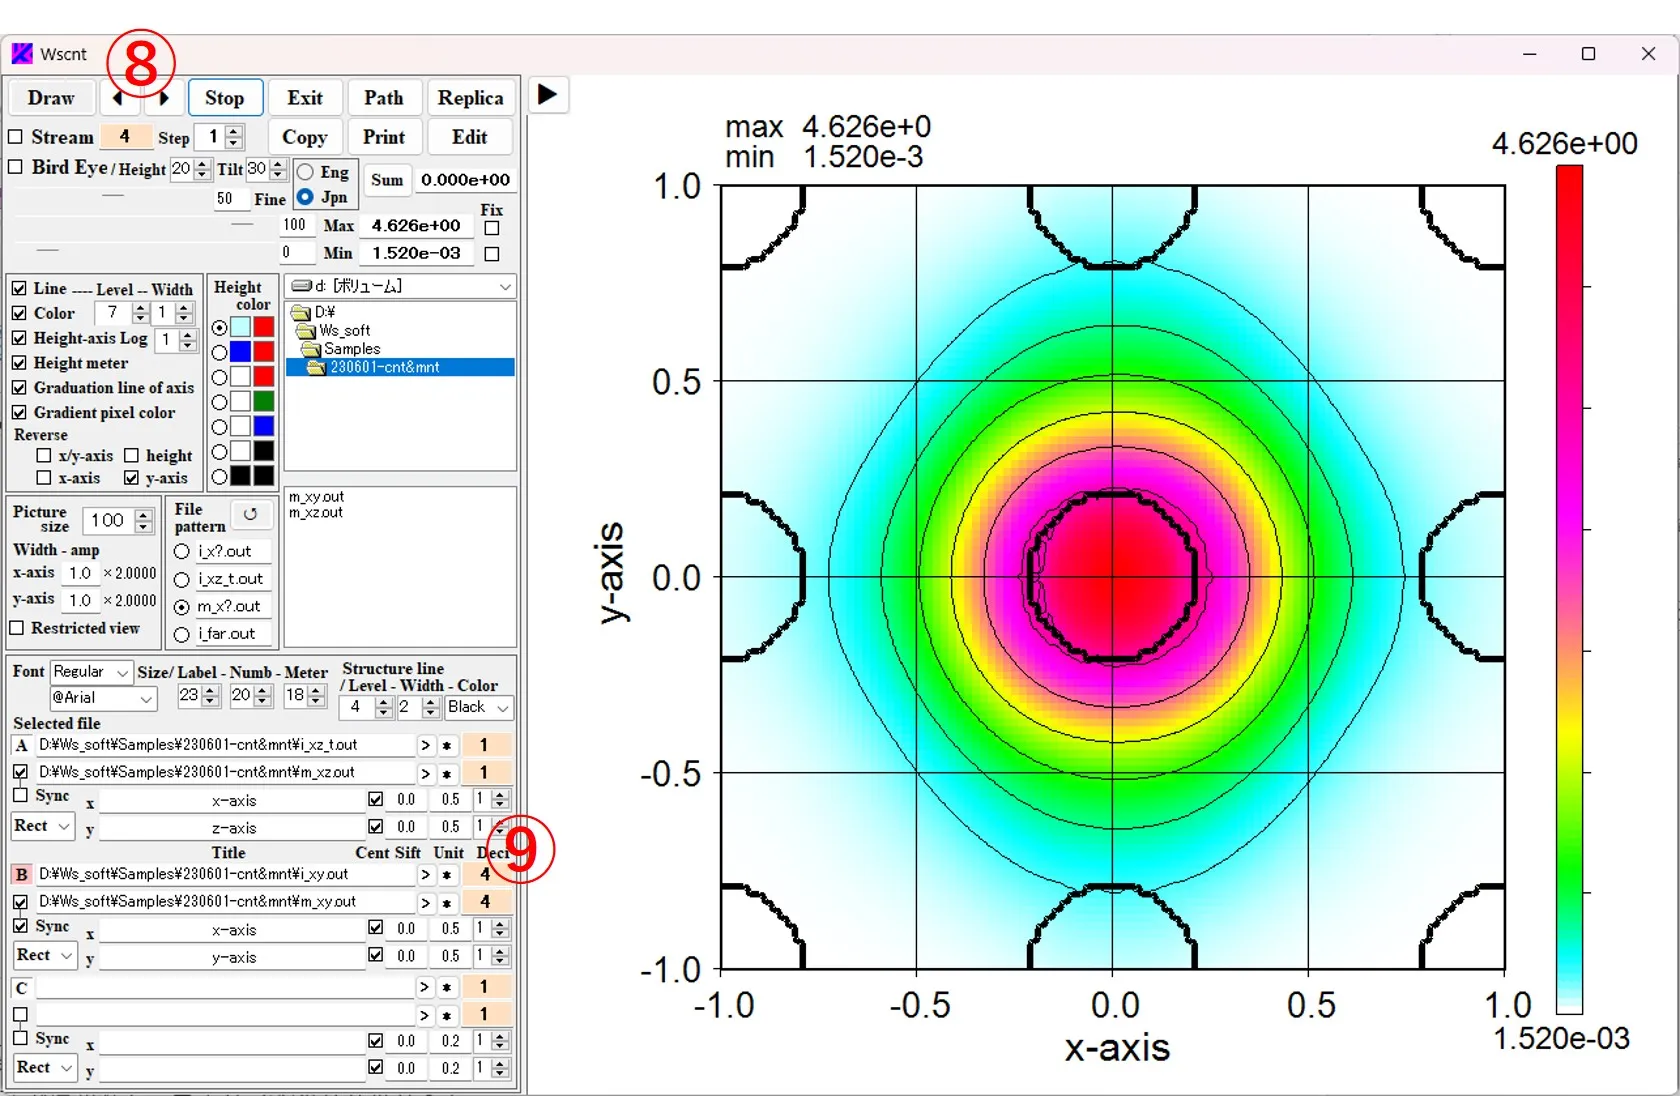
(10) Synchronous display: Click the button B ①, click the box ② and select the file (i_xy.out). Check the box ③ and click the box ④ to select the file (m_xy.out). Since both of these files are synchronized serial image data, the Sync box ⑤ can be checked. Click the Draw button ⑥ to display the first contour image ⑦. When the button ▶ ⑧ is clicked and the order of the data (i_xy.out) on the contour image is advanced, the order of the data (m_xy.out) of the structural boundary also proceeds as shown in ⑨, and the structural boundary is rewritten synchronously with the contour image.
(2) Click the button ◀ ⑤ to display the operation panel.
② Right-click to move the directory list to the directory of the display file, and double-click to delete the displayed contents.
③ Right-click to switch the vertical size to long and short.
④ If the contents of the left file path box exceed the box length, it is slided left and right.
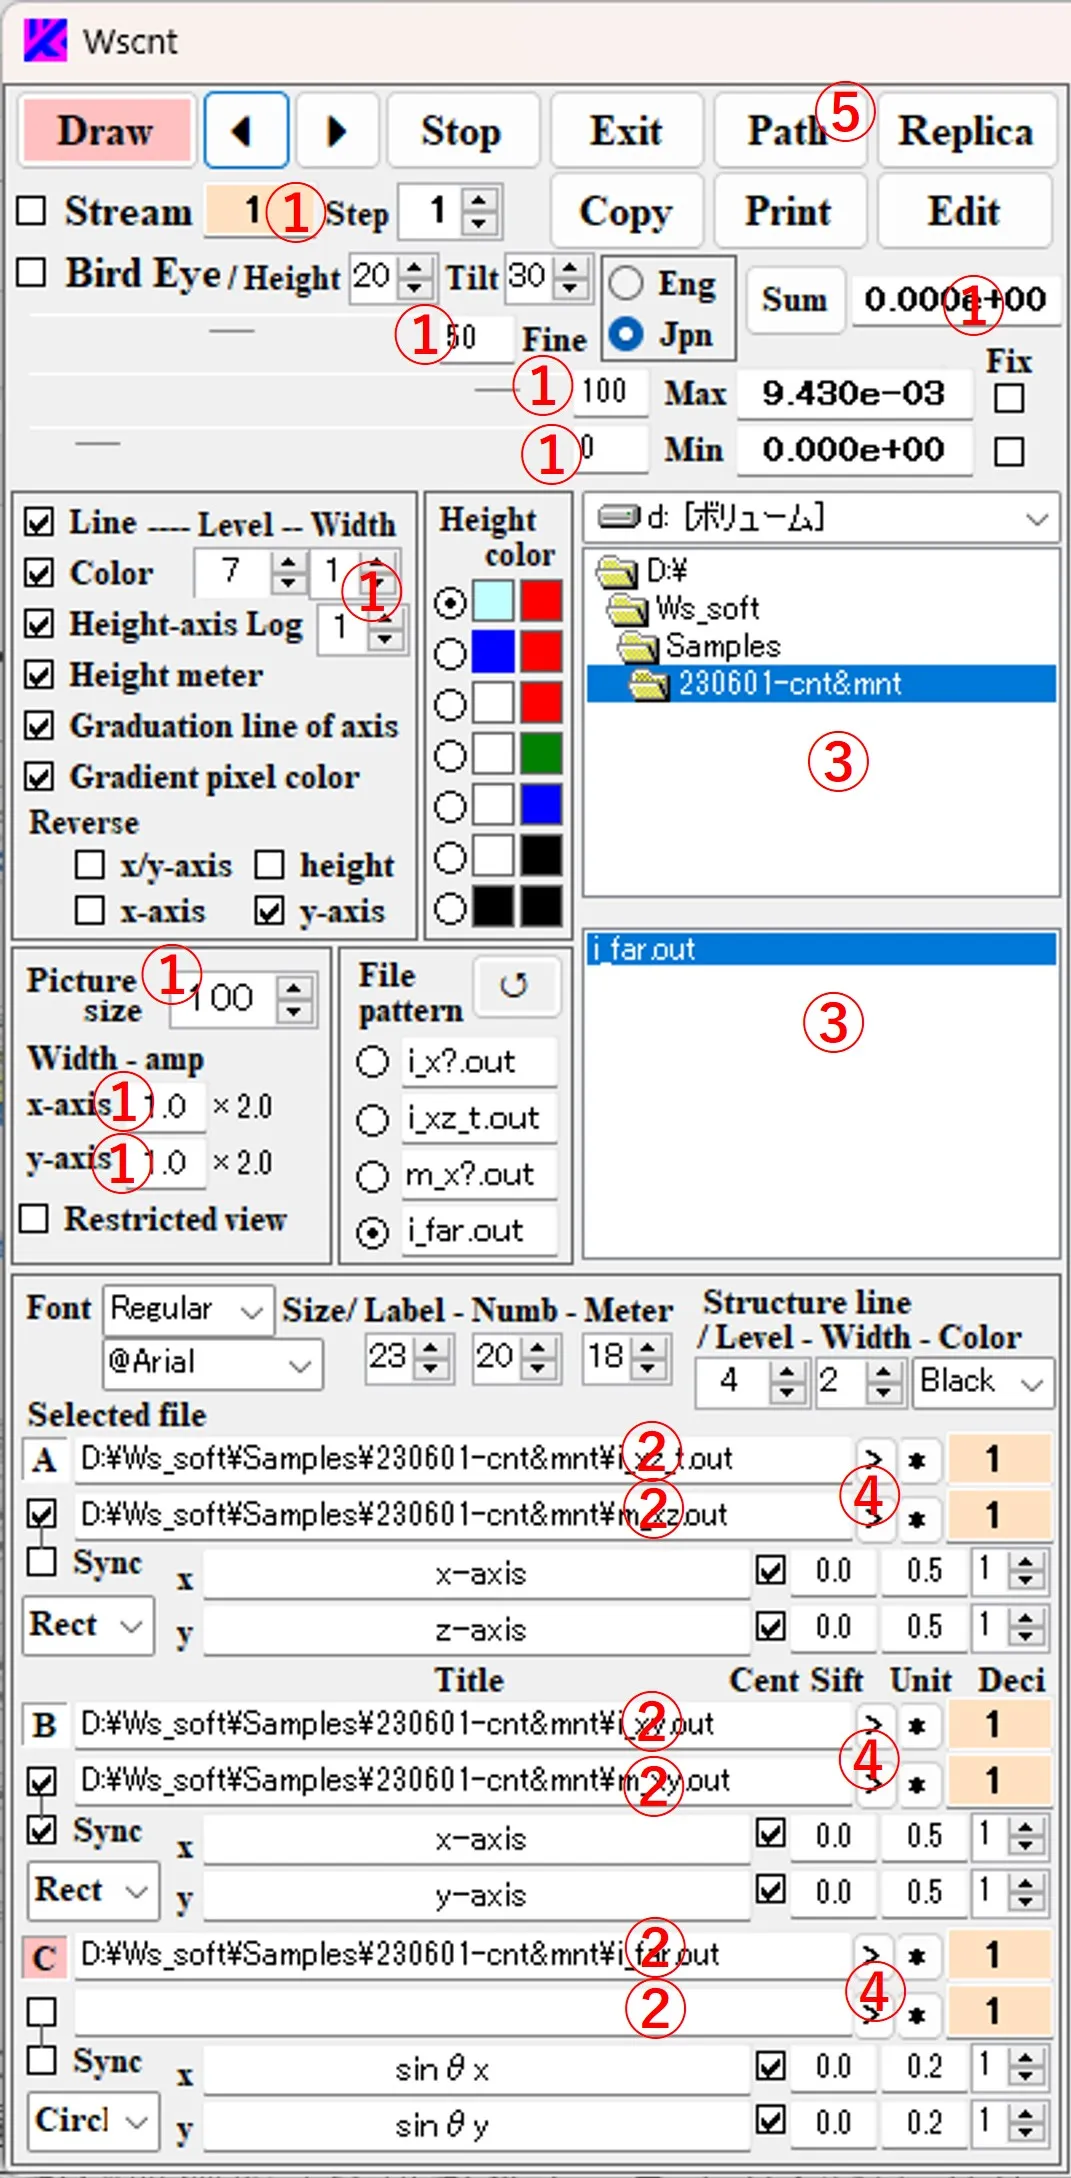
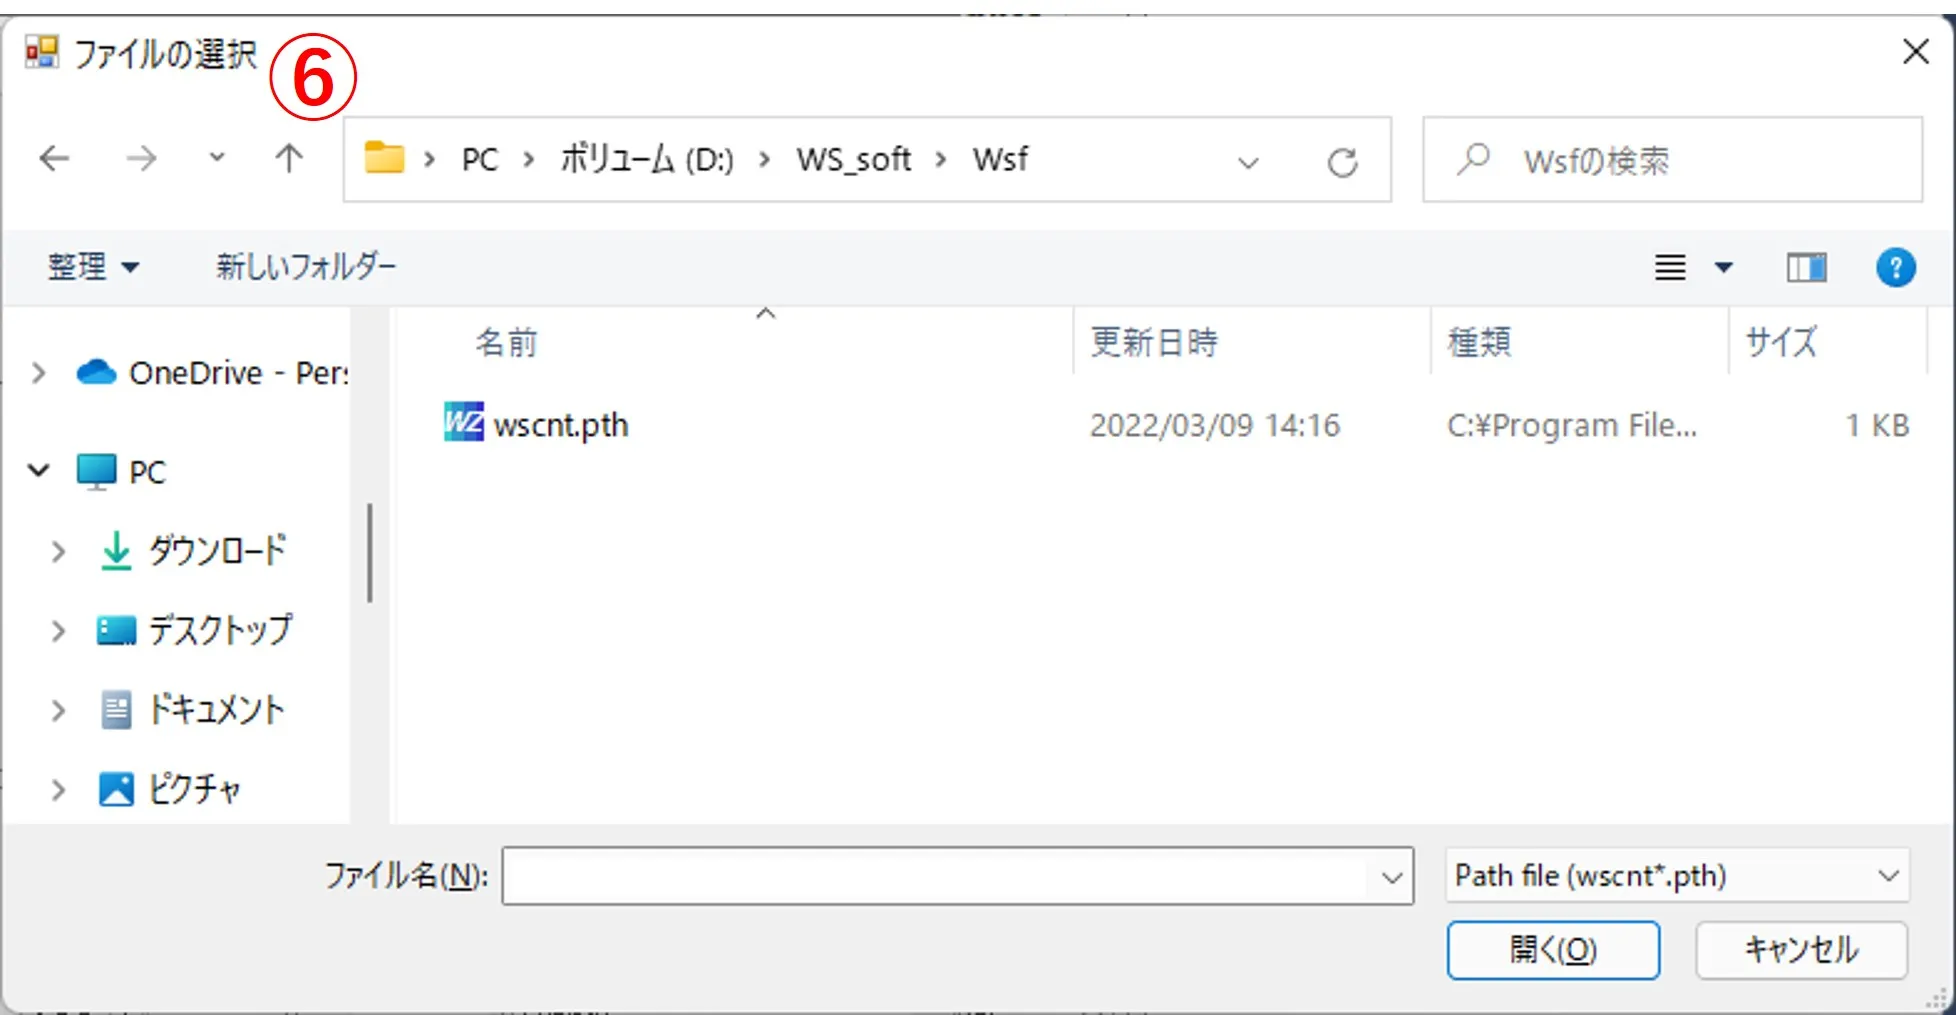
⑤ The history of past operations is refered. When you click the button, the file selection window ⑥ appears, and if you select the desired wscnt.pth from here, the main window performed in the past is reproduced. The file of wscnt.pth is created (overwritten) in the folder containing the file of Wscnt.exe and the folder listed in the file path box (the box on the right side of buttons A, B, and C) each time the Draw button is pressed.
● 2. Displaying a contour Image
● 3. How to edit contour data
● 4. Editing Existing Drawing Data
● 5. Bird's eye view
● 6. Viewing the contents of data
● 7. Stretching an image
● 8. Axis inverting of images
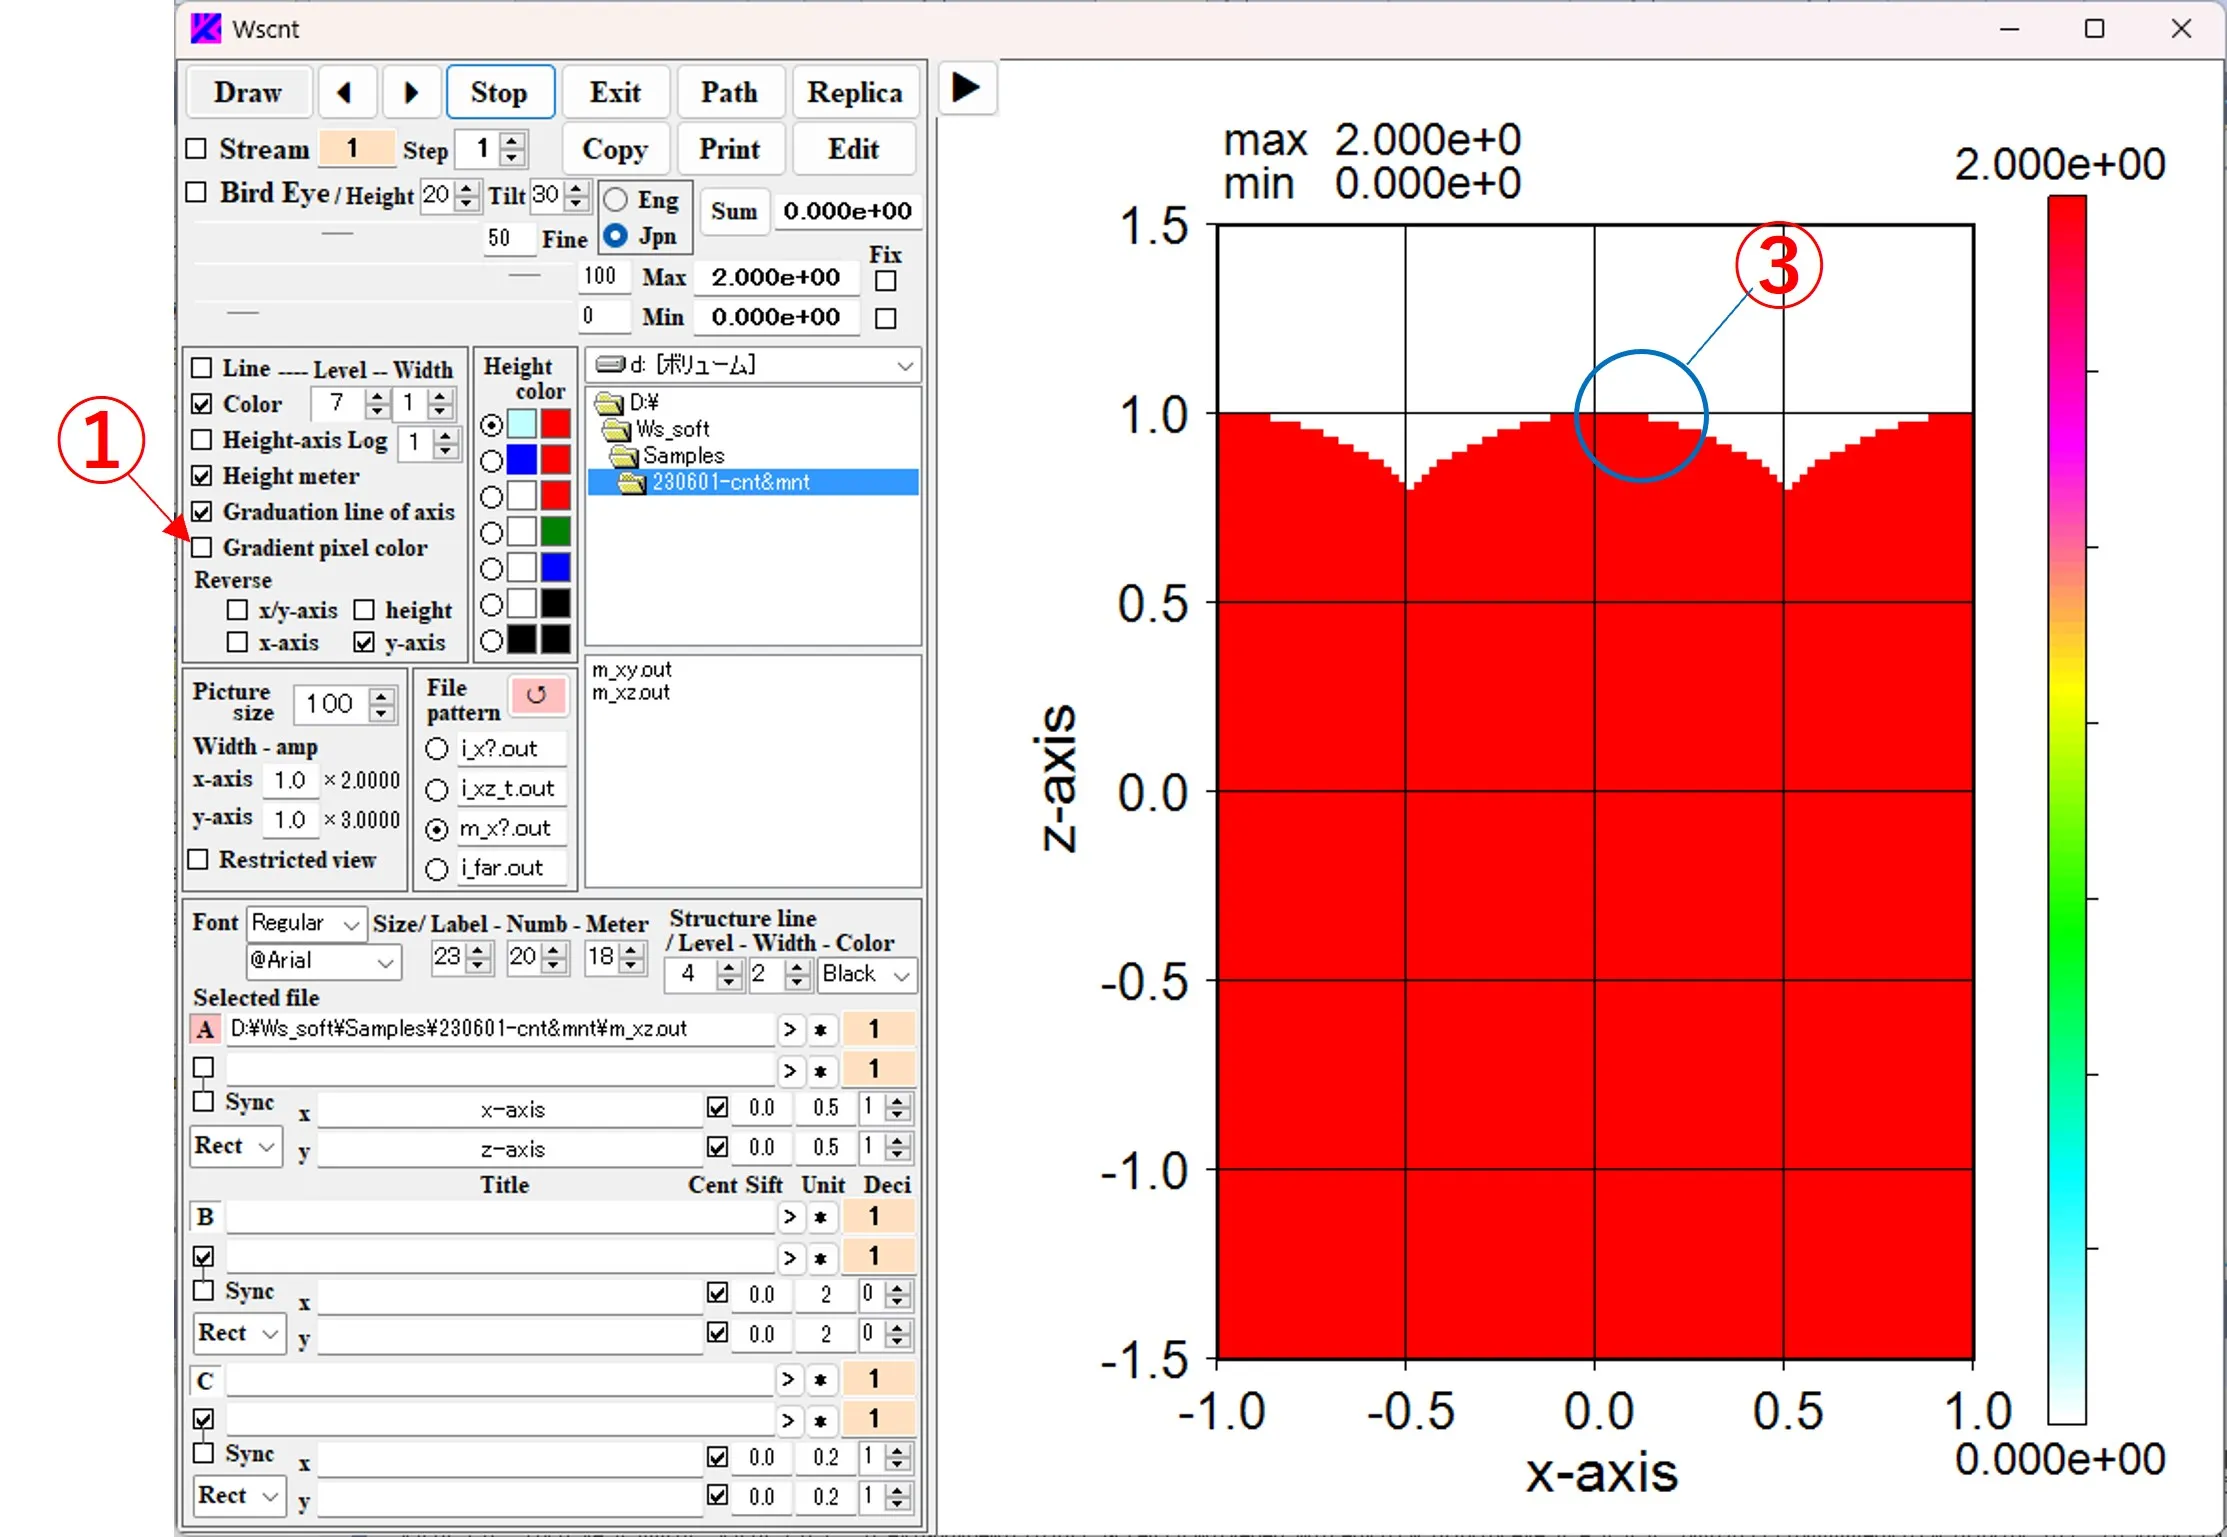
● 9. Showing only contour lines
● 10. Choosing a pixel drawing method
● 11. Bird's eye view
● 12. Calculation of the sum value, cuting and pasting images
● 13. Displaying serial images
● 14. Displaying circular coordinates, stretching the operation panel
● 15. Useful shortcuts
Let's render the output results of Wsf, Wsr, and Wsb as contour plots and bird's eye views. Normally, it is automatically set by Wsems and contour lines are drawn, but here we will explain how to operate it manually.
1. Specifying a drawing file and setting axis conditions ▲top
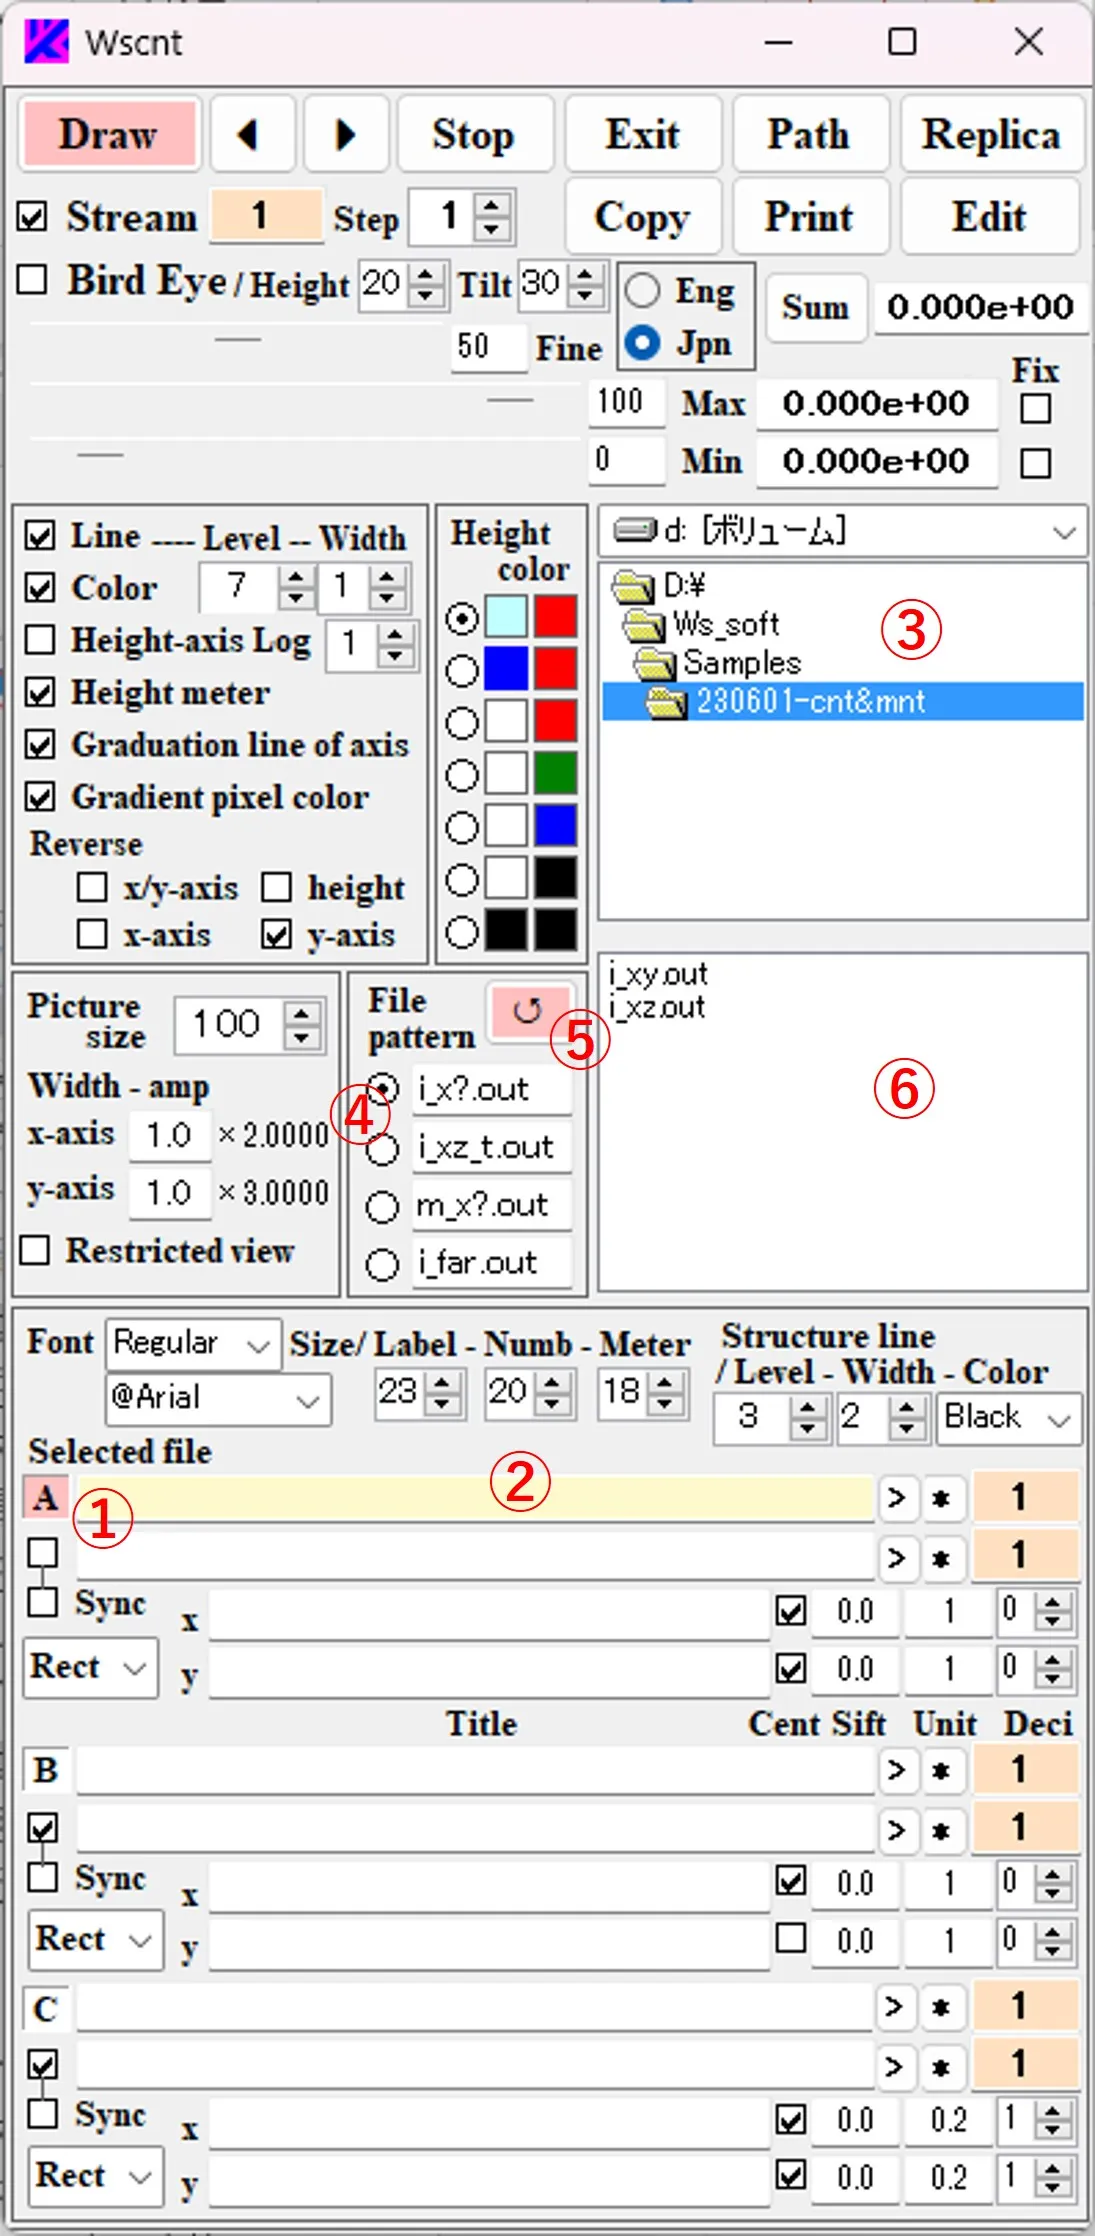
(1) Double-click the wscnt.exe in \ws_soft\wsems to open the main window of Wscnt. When the button A ① or the box ② is clicked, the background color of ① changes to pink and the background of ② changes to yellow. Select the drive and directory from the list boxes ③. Select and edit the file pattern ④. Click the ↺ button ⑤ to reflect the change in the file pattern in the file list ⑥.
(2) When the file ⑦ is selected from the file list ⑥, the path and the file name are described in box ②. If the path name is long and sticks out of the box, you can slide it with the click of the > button.

(3) In box ⑧, select "Rect" (square coordinates) as the axis type. Enter the title of the axis in boxes ⑨, the axis unit in boxes ⑩, the axis shift width in boxes ⑪, and the number of decimal places in the axis unit in boxes ⑫. The box ⑬ changes to a black check-mark by click and a gray check-mark by right-click. If there is no check, the origin of the axis value is at the lower (left) axis intersection. If black-checked, the origin is at the center of the axis. If it gray-checked, the origin is at the upper (right) axis intersection.

(4) To add a structural border, select the number of division levels, line width, and line color in the boxes of ⑭, ⑮, and ⑯, check box ⑰, click box ⑱ to change the background color to yellow. By selecting the file pattern ⑲ and selecting the file ⑳ from the file list ⑥, the path and file name are described in the box ⑱. The number of division levels in the box ⑭ is set to the number of materials used in the optical calculation + 1.

(5) The operation of buttons B ㉑ and C ㉒ is the same, and data of the button with a pink background color is the target of drawing.

(6) If you right-click boxes ② and ⑱, boxes ③ and ⑥ are aligned in the path of the described file. Double-click boxes ② and ⑱ to erase the description and to change the background color to yellow. A box with a yellow background is used to enter the path and the file name.

2. Displaying a contour Image ▲top
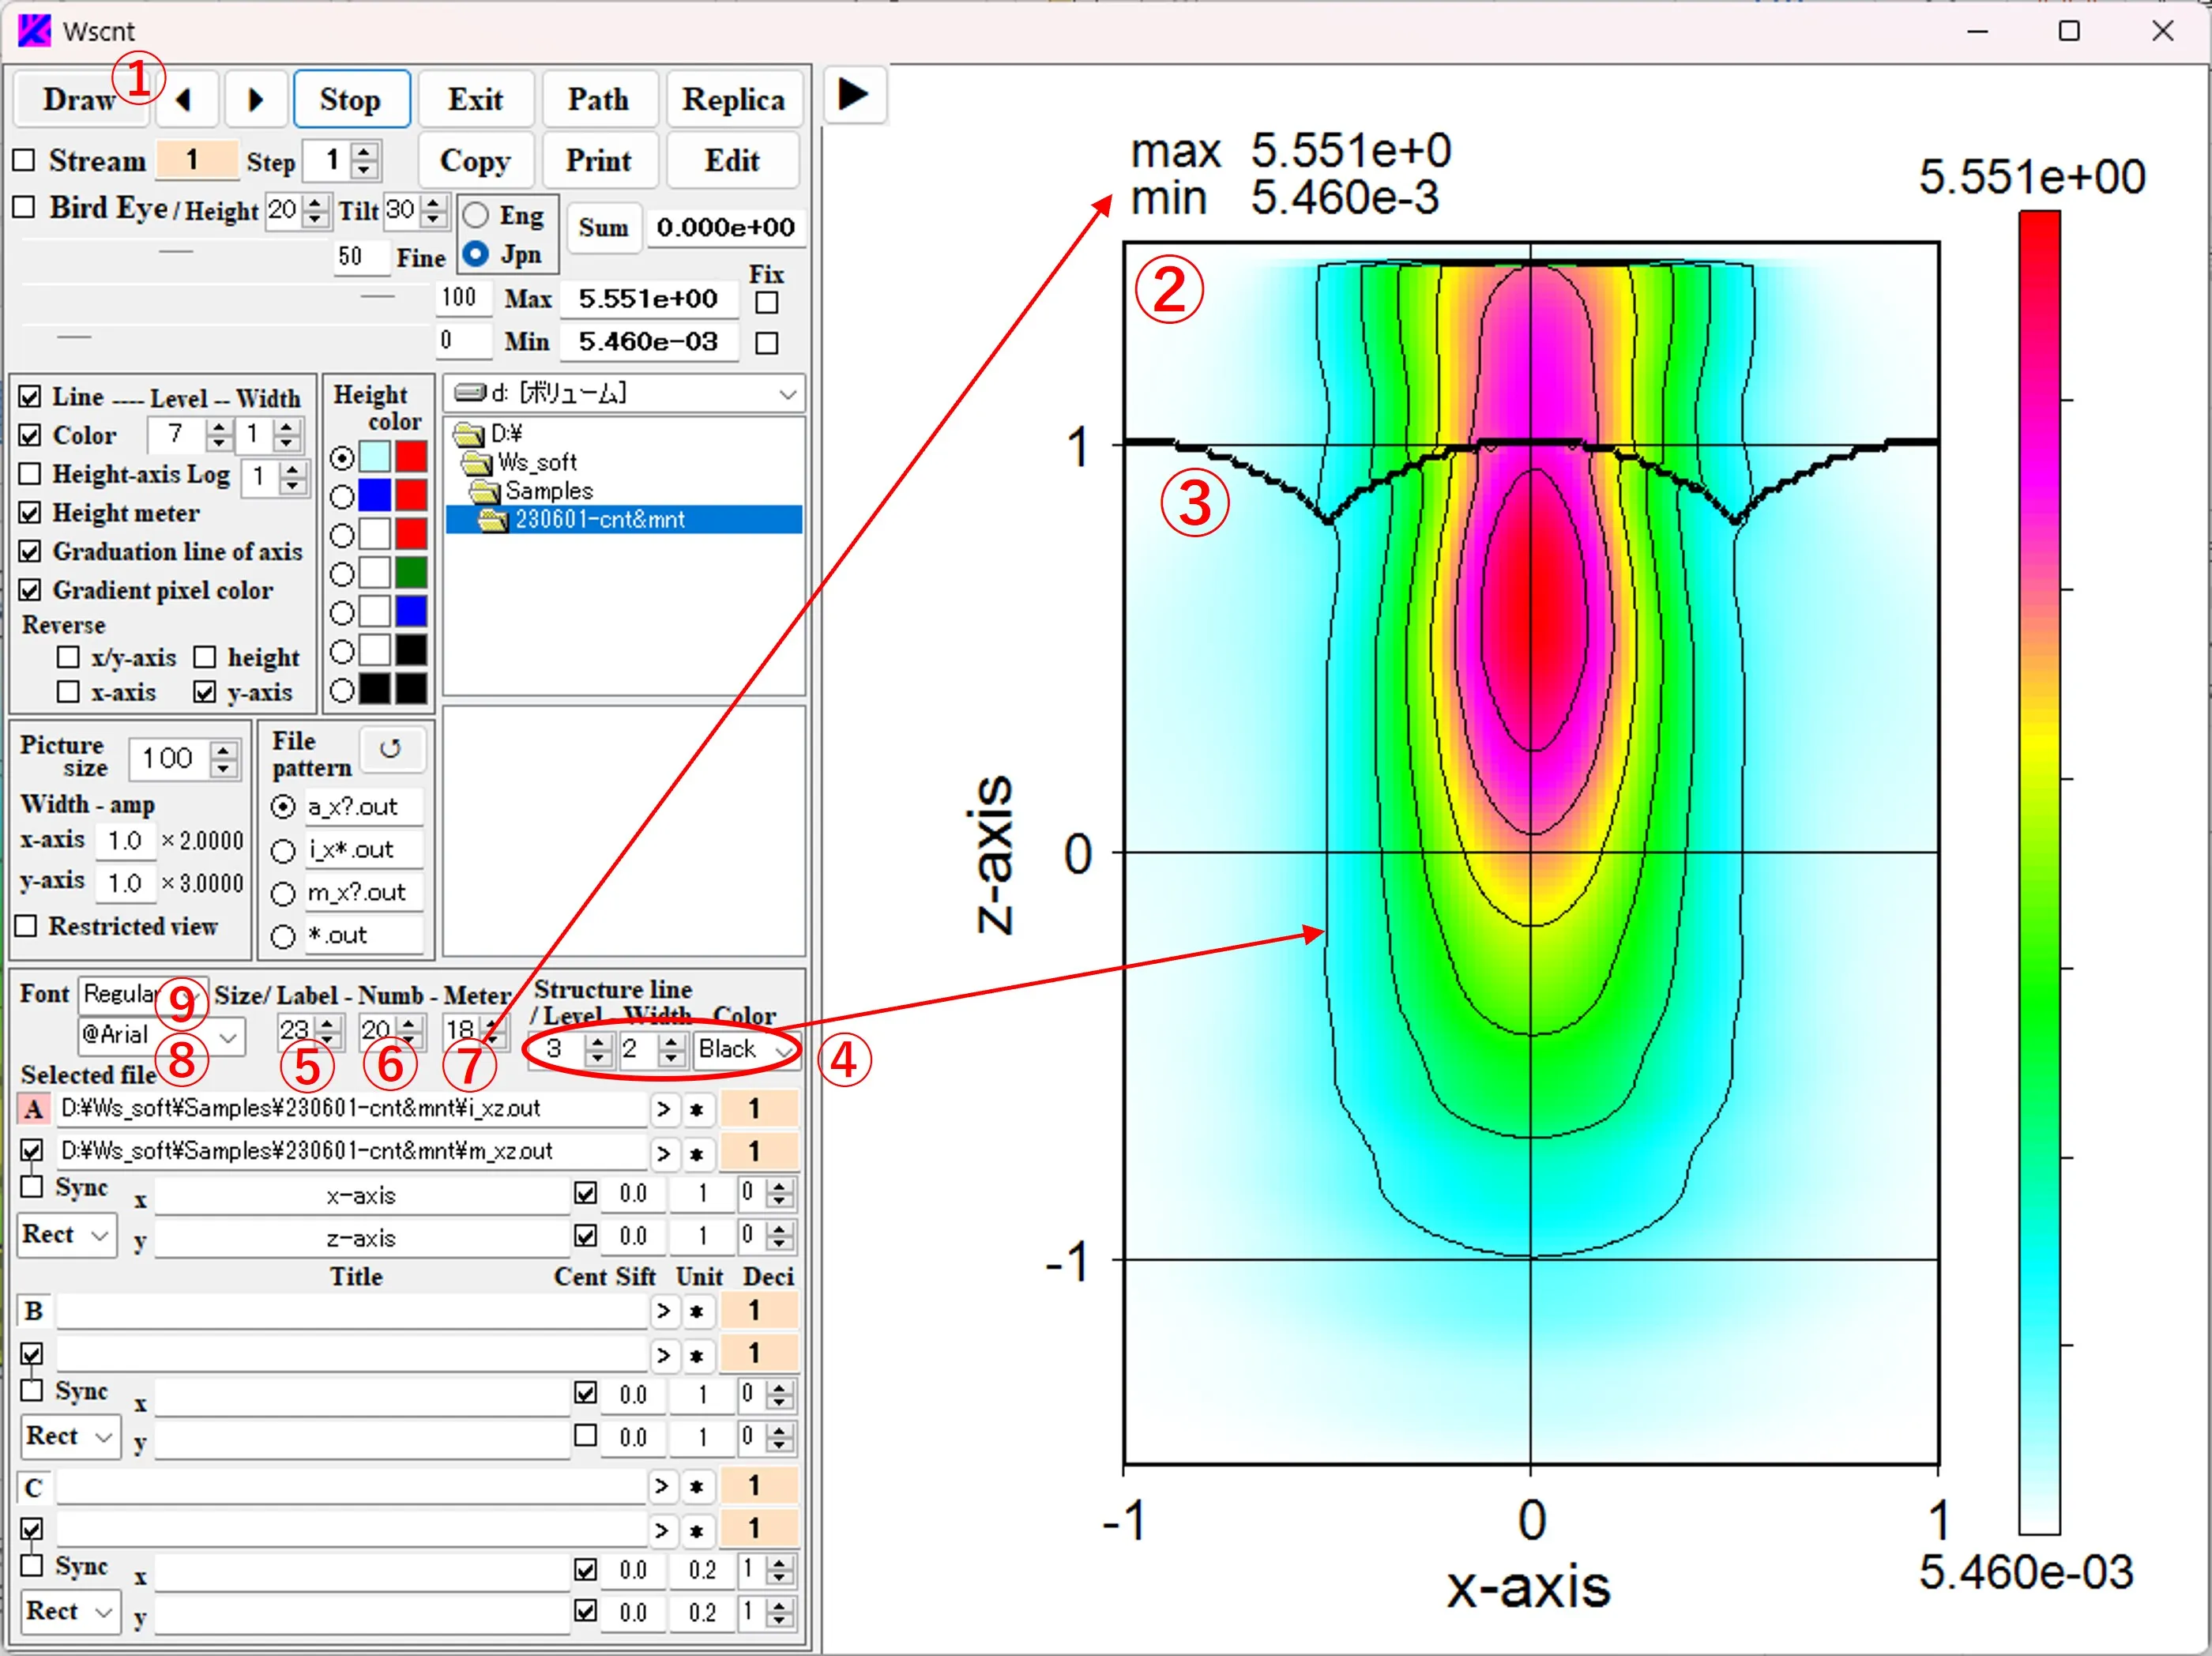
(1) Click the Draw button ① to display the contour line image ② with structural boundary lines ③. The number of division levels, thickness, and color of the structural contour lines can be specified with the boxes ④. The sizes of axis labels are set by ⑤, the scales of axis numbers are by ⑥, the label sizes of “Max” and “Min” in the upper left corner of the image are set by ⑦, and their font and style can be set by ⑧ and ⑨.
(2) Check boxes ⑩, ⑪, and ⑫ set whether the height meter, scale lines, and contour lines are displayed or not. Box ⑬ means the number of contour levels (the number of divisions between the maximum value “Max” and the minimum value “Min”). “Max” and “Min” for the image data are displayed in box ⑭ and at the upper left corner of the figure. ⑮ is a scroll bar for image definition. The larger the value, the higher the definition and the slower the imaging speed, so about 50 is preferred as a scroll value on the right box. Scroll bars ⑯ and ⑰ determine the level of contour color for the largest and smallest sides, respectively, and their scroll values are displayed on the right.

(3) The clipboard copying by ⑱, printing by⑲ and duplication of images are done by ⑳. Click the Exit button ㉑ to exit the program.

3. How to edit contour data ▲top
Let's convert the contour line data of the Excel file to the drawing data for Wscnt.(1) Specify the area you want to convert in the contour data sub_data.xlsx of the Excel file and copy it.

(2) Paste the copy into the left box ① of the Edit window. Set the width ② in the x and y directions of the data.

(3) When you click the button ③, the data is converted to a space-separated numeric sequence as shown in ④, the first row ⑤ is added, and it appears in the right box of the Edit window. The first row ⑤ is a 10-column number of 6 columns including the numbers of columns and rows for data, and the width in the x and y directions, and corresponds to the contents ⑥ above the left box.

(4) If you want to add more contour data, copy the corresponding contour data and paste it into the left box ⑦ of the Edit window. Set the width ⑧ in the x and y directions of the data.

(5) When the button ⑨ is clicked, the data is converted, and the first row is added below the preceding data in the right box of the Edit window as shown in ⑩.

(6) When deleting contour data, the background color for the data changes to orange when the first row ⑪ of the corresponding data is clicked, and the colored part is deleted when the button ⑫ is clicked.

(7) When the button ⑬ is clicked, the file selection window ⑭ appears, the file name ⑮ is entered, and the button ⑯ is clicked, and it is saved as drawing data for Wscnt. All output data generated by Wsf, Wsr, Wsb, etc., such as i_xz.out and i_xz_t.out, are rendered data for Wscnt.


4. Editing Existing Drawing Data ▲top
Let's edit existing drawing data for Wscnt.(1) Call and copy the existing drawing data for Wscnt in the editor (Notepad).

(2) Copy and paste in the left box ① of the Edit window. When the button ② is clicked, the drawing data for Wscnt appears in the right box of the Edit window as shown in ③. In this case, since the first row is included in the pasted data, the setting of the width ④ in the x and y directions does not work. When the button ⑤ is clicked, it is saved as drawing data for Wscnt.


5. Bird's eye view ▲top
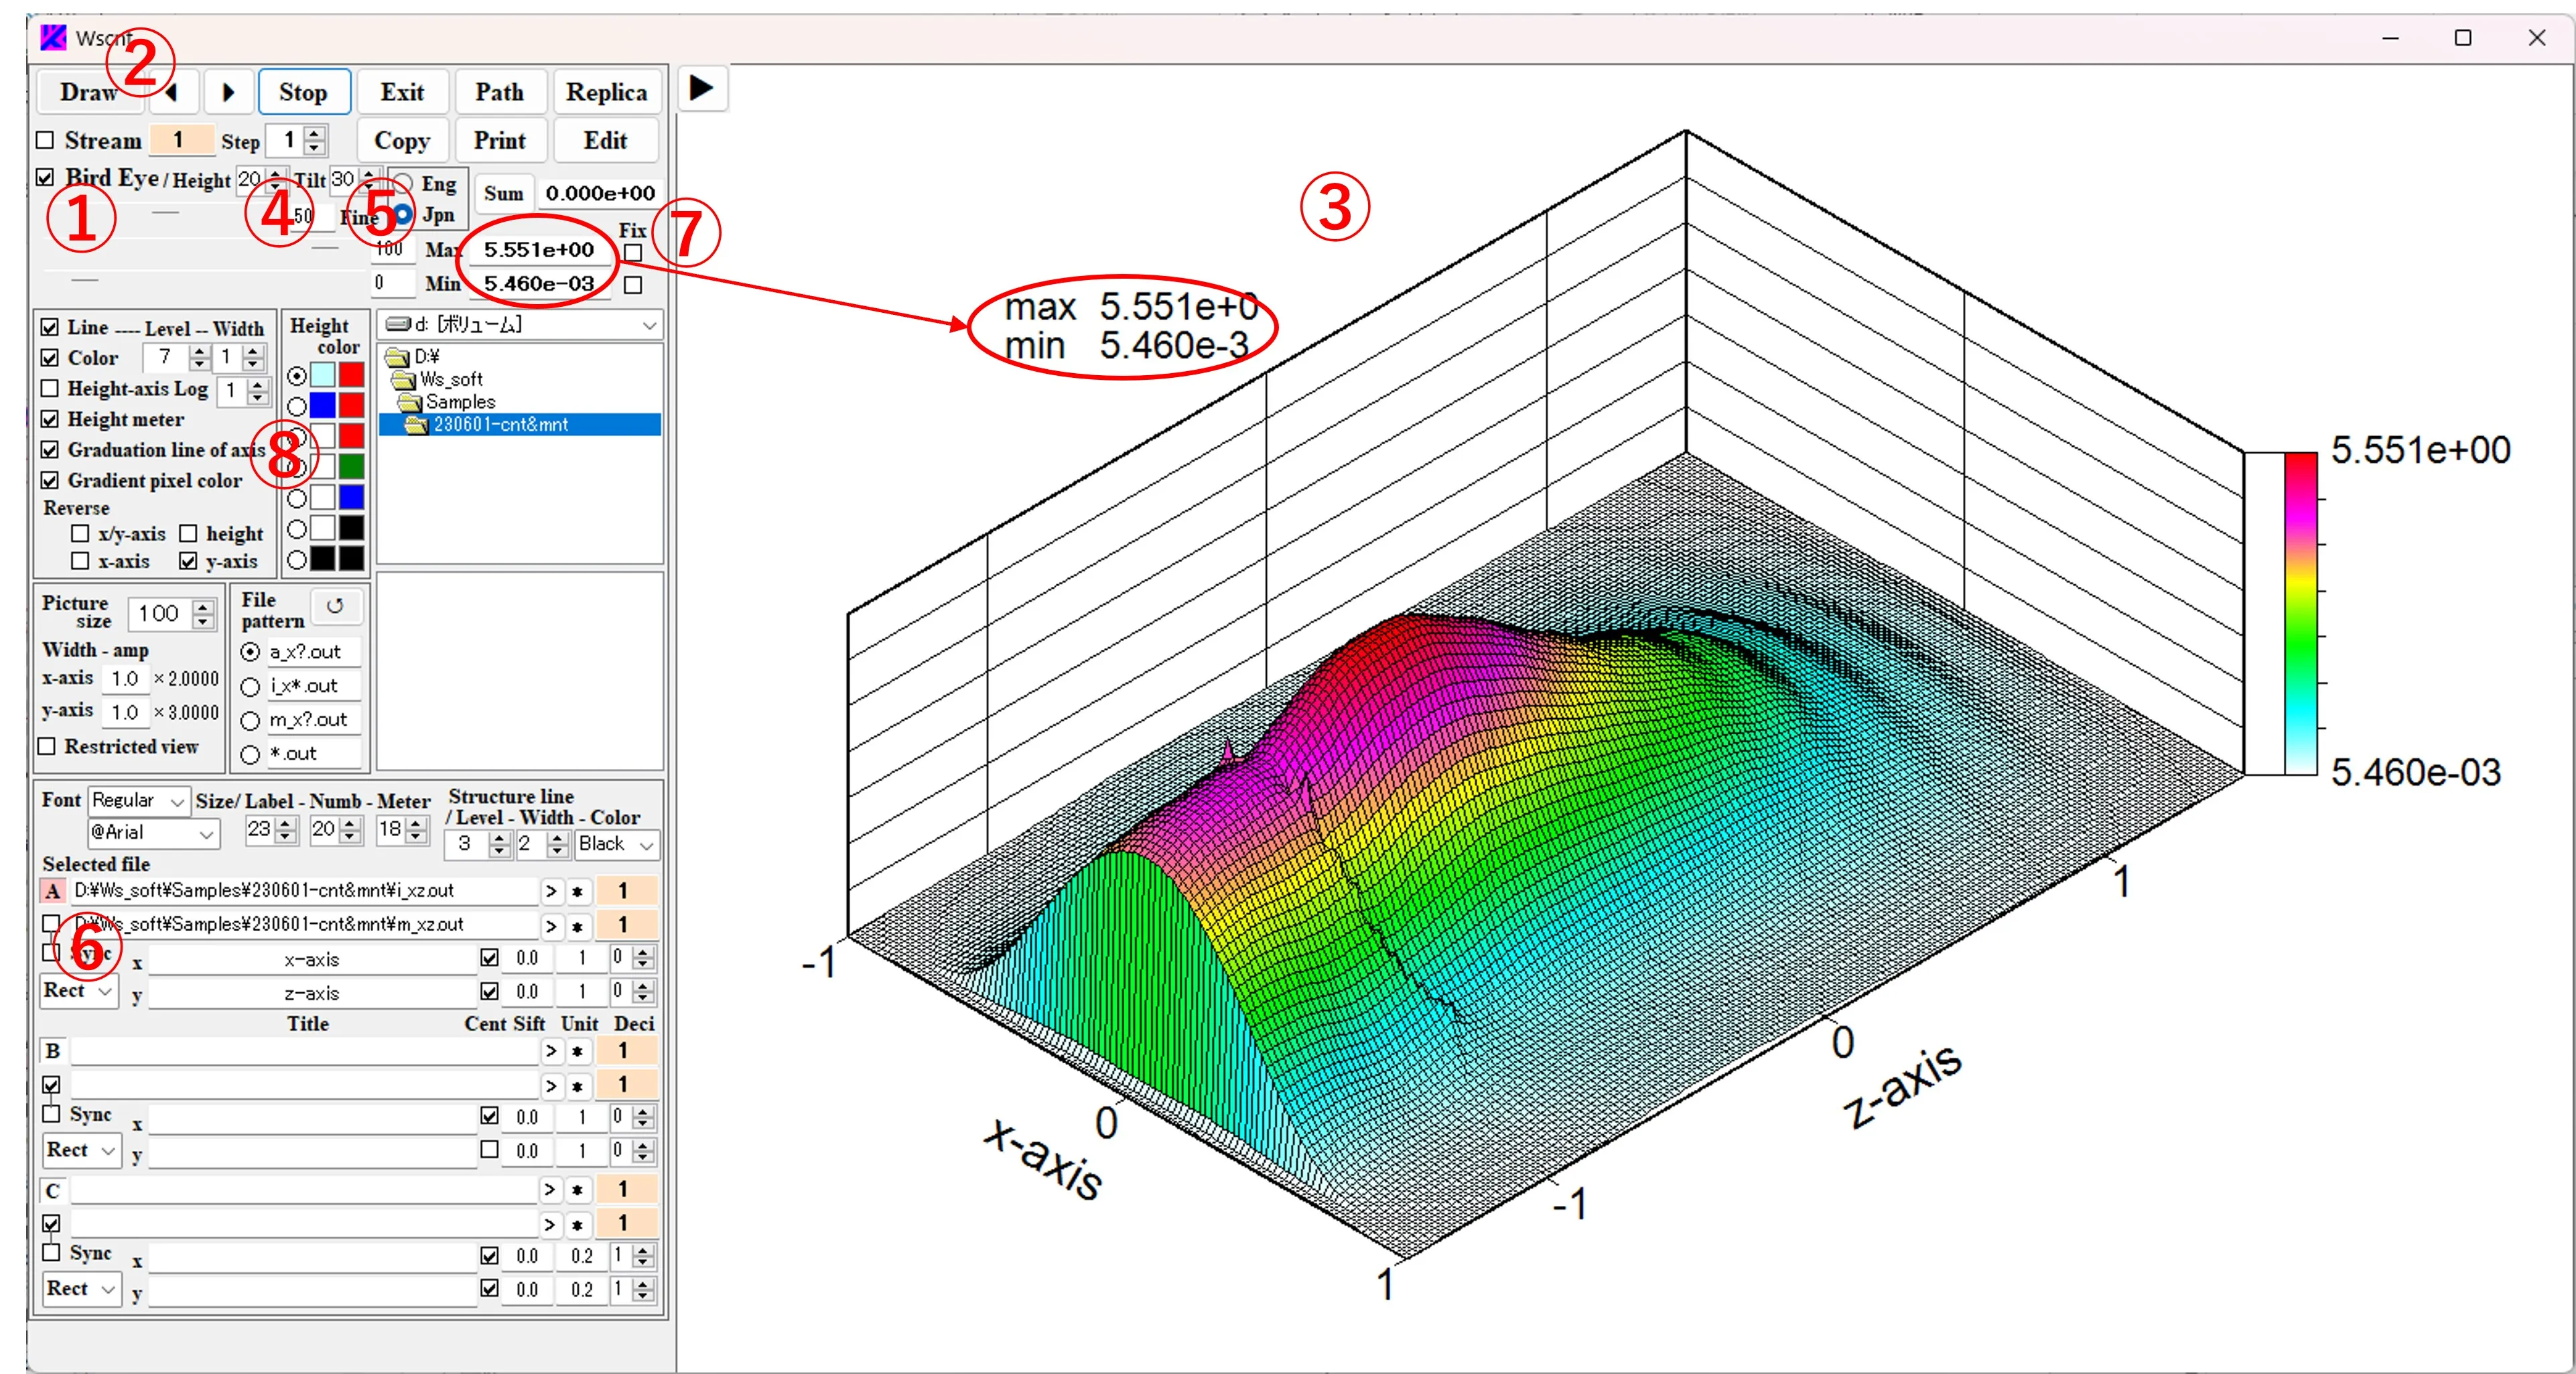
Check the Bird's eye box ① and click the Draw button ② to display the bird's eye view image ③. Boxes ④ and ⑤ allow you to select the height, width, and angle of view. Structural boundaries are ignored and check ⑥ is missed. The Max and Min values of the image data are displayed in box ⑦ and in the upper left corner of the figure. The contour color can be changed with the buttons ⑧.
6. Viewing the contents of data ▲top
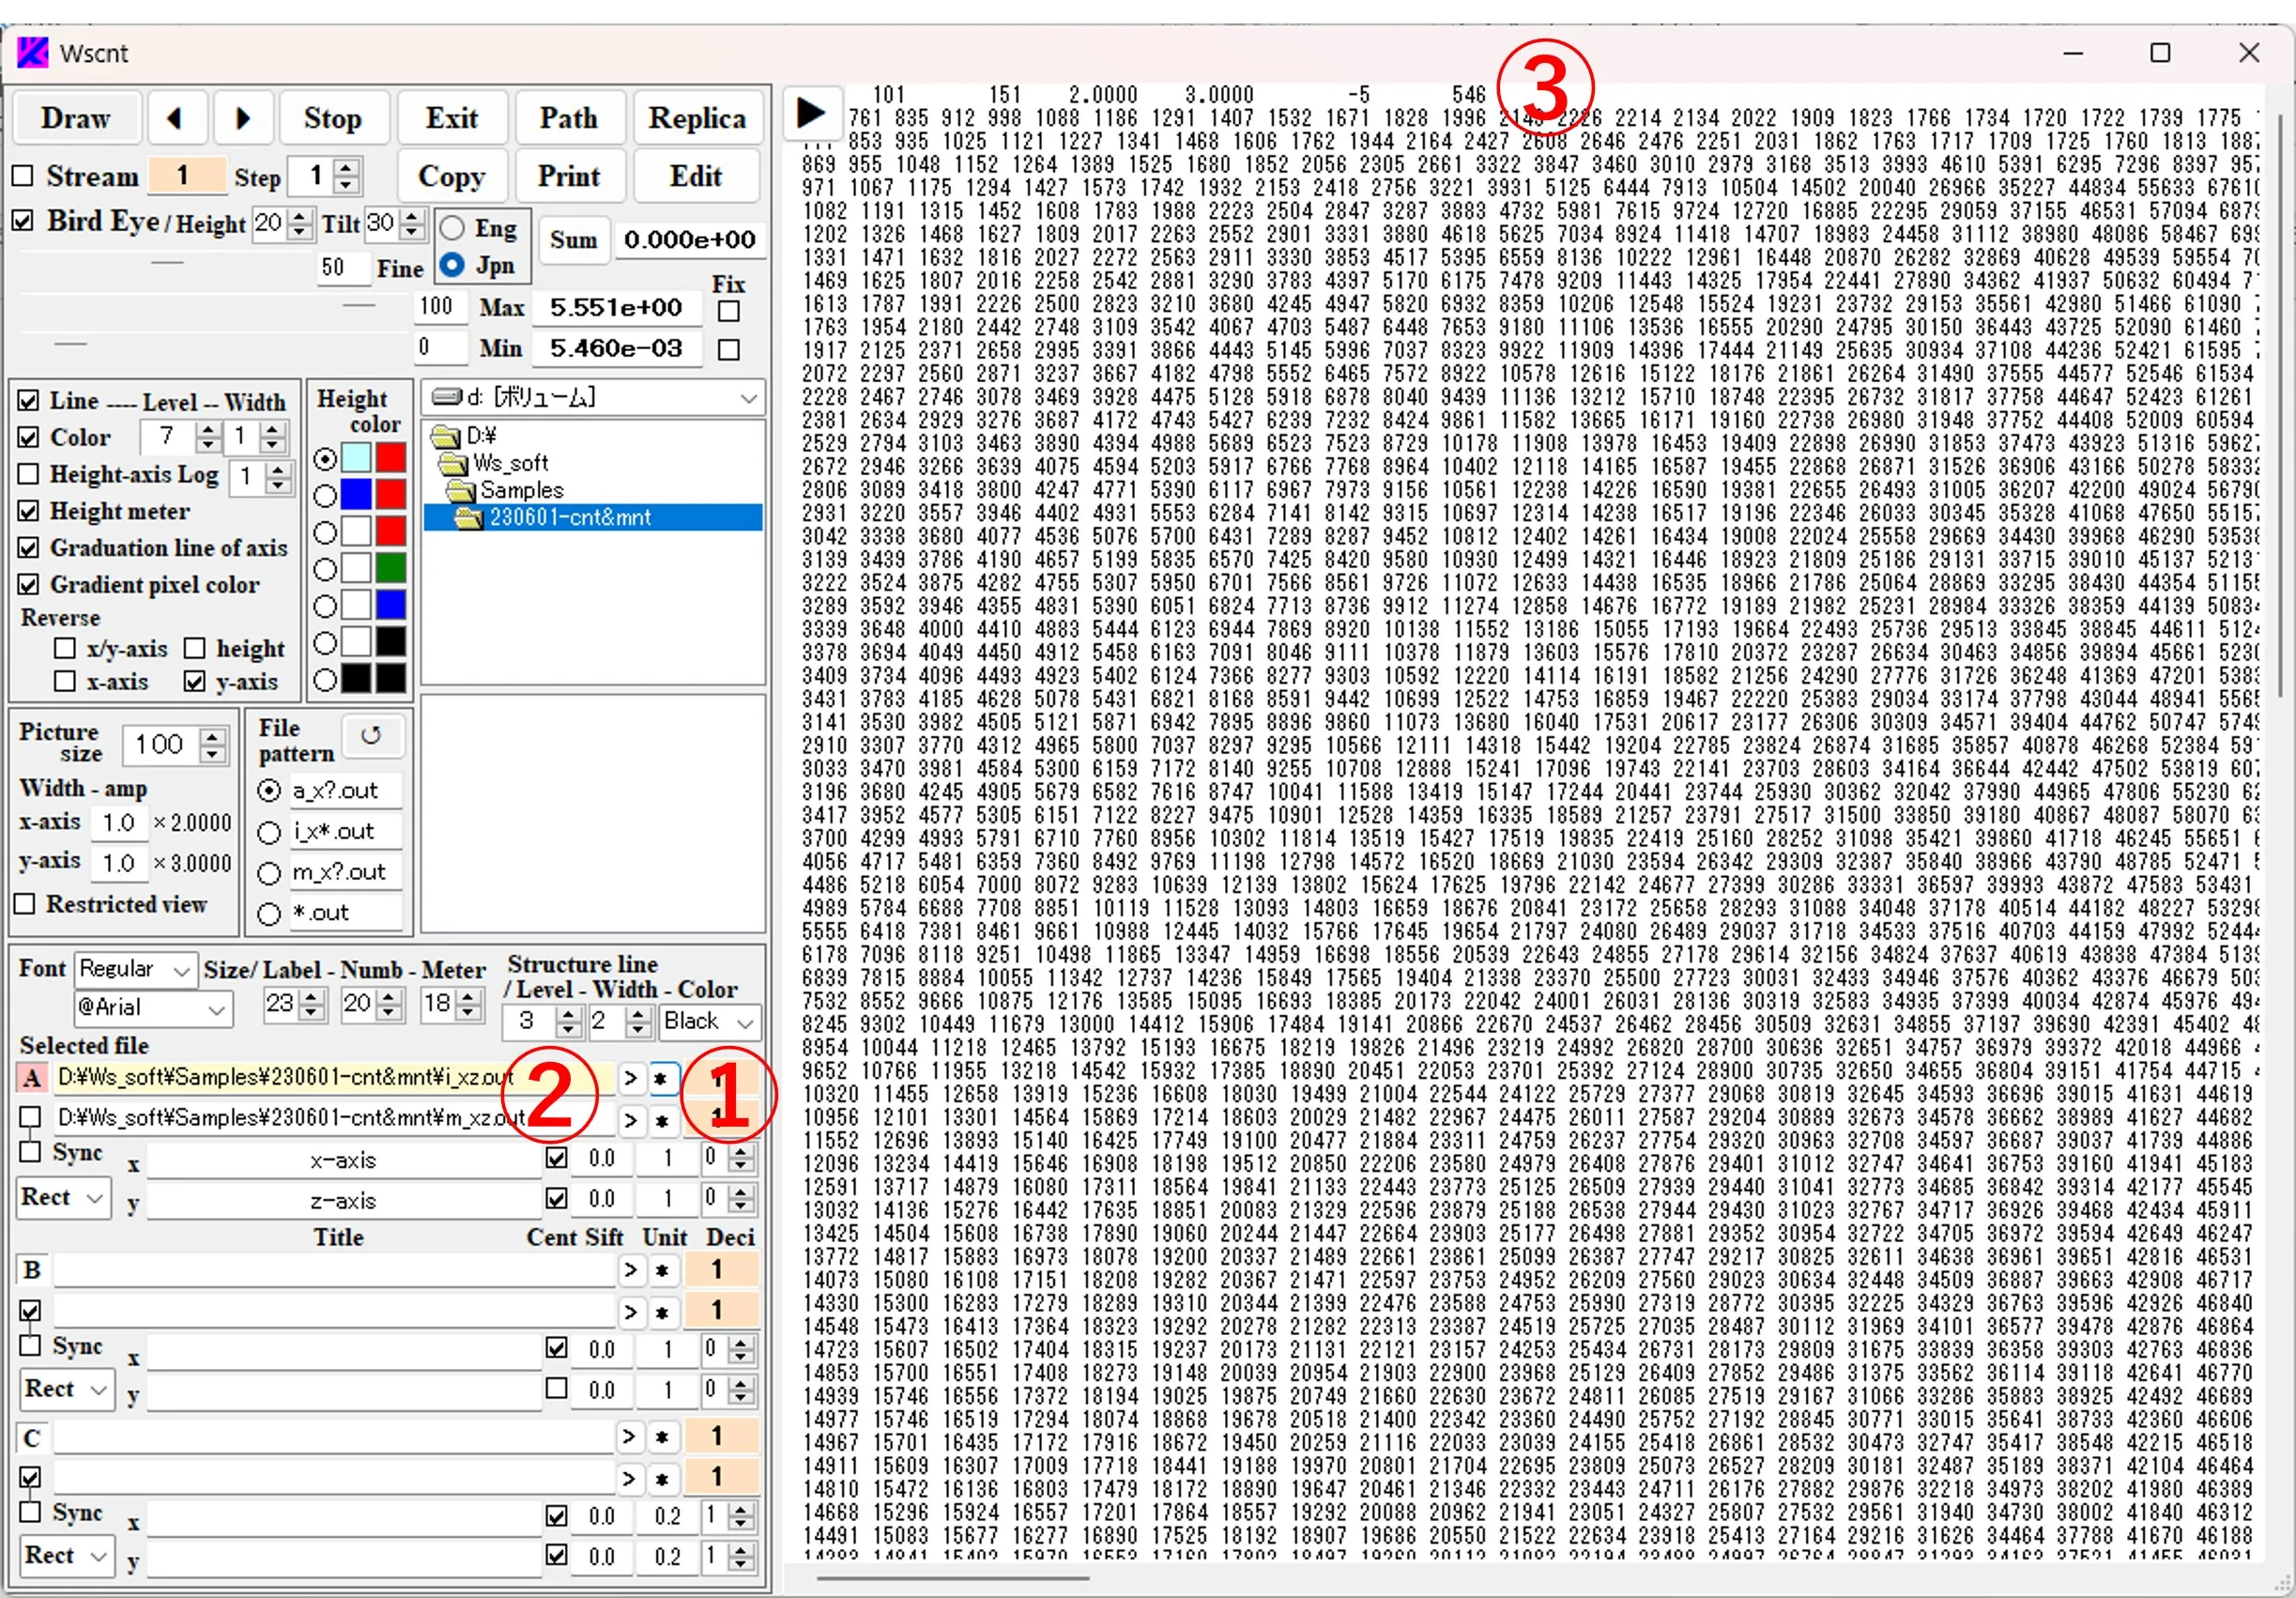
When the * button ① to the right of the box ② is clicked, the contents of the file ③ described in the box ② are displayed.
7. Stretching an image ▲top
(1) When the Draw button ② is clicked by changing the box value ① under Amp, the horizontal (or vertical) scale of the image is stretched and displayed as shown in ③.
(2) When the box value ④ (% magnification value) next to Picture size is changed, the overall scale of the image expands and contracts as shown in ⑤.

(3) If you check ⑥ and click the Draw button ②, the drawing screen is restricted while the stretch magnification remains the same, and you can move any position of the stretched figure by scrolling vertically and horizontally in the drawing drawing panel.

8. Axis inverting of images ▲top
(1) y_axis flips upside down depending on whether or not the button ① is checked. Similarly, checking button ② reverses the left and right sides of the x_axis.
(2) Checking the X/y_axis button ③ switches the X-axis (horizontal axis) and Y-axis (vertical axis).

(3) Check the Height button ④ to reverse the high and low axes.

9. Showing only contour lines ▲top
If Color box ⑤ is unchecked, the contour color disappears and only the contour line is obtained. The number of contour lines is specified by the value in box ⑥ (number of contour lines = box value - 1). The width of the contour lines is specified in box (7).
10. Choosing a pixel drawing method ▲top
(1) Box ① is checked→ ② Leveling with peripheral pixels is available.
(2) Box ① is not checked→ ③ No leveling process with peripheral pixels

11. Bird's eye view ▲top
(1) Displaying mesh only: If you uncheck the Color box ①, it will be only mesh.
(2) Display without mesh: If you uncheck the Line box ①, only contour colors will be displayed.

12. Calculation of the sum value, cuting and pasting images ▲top
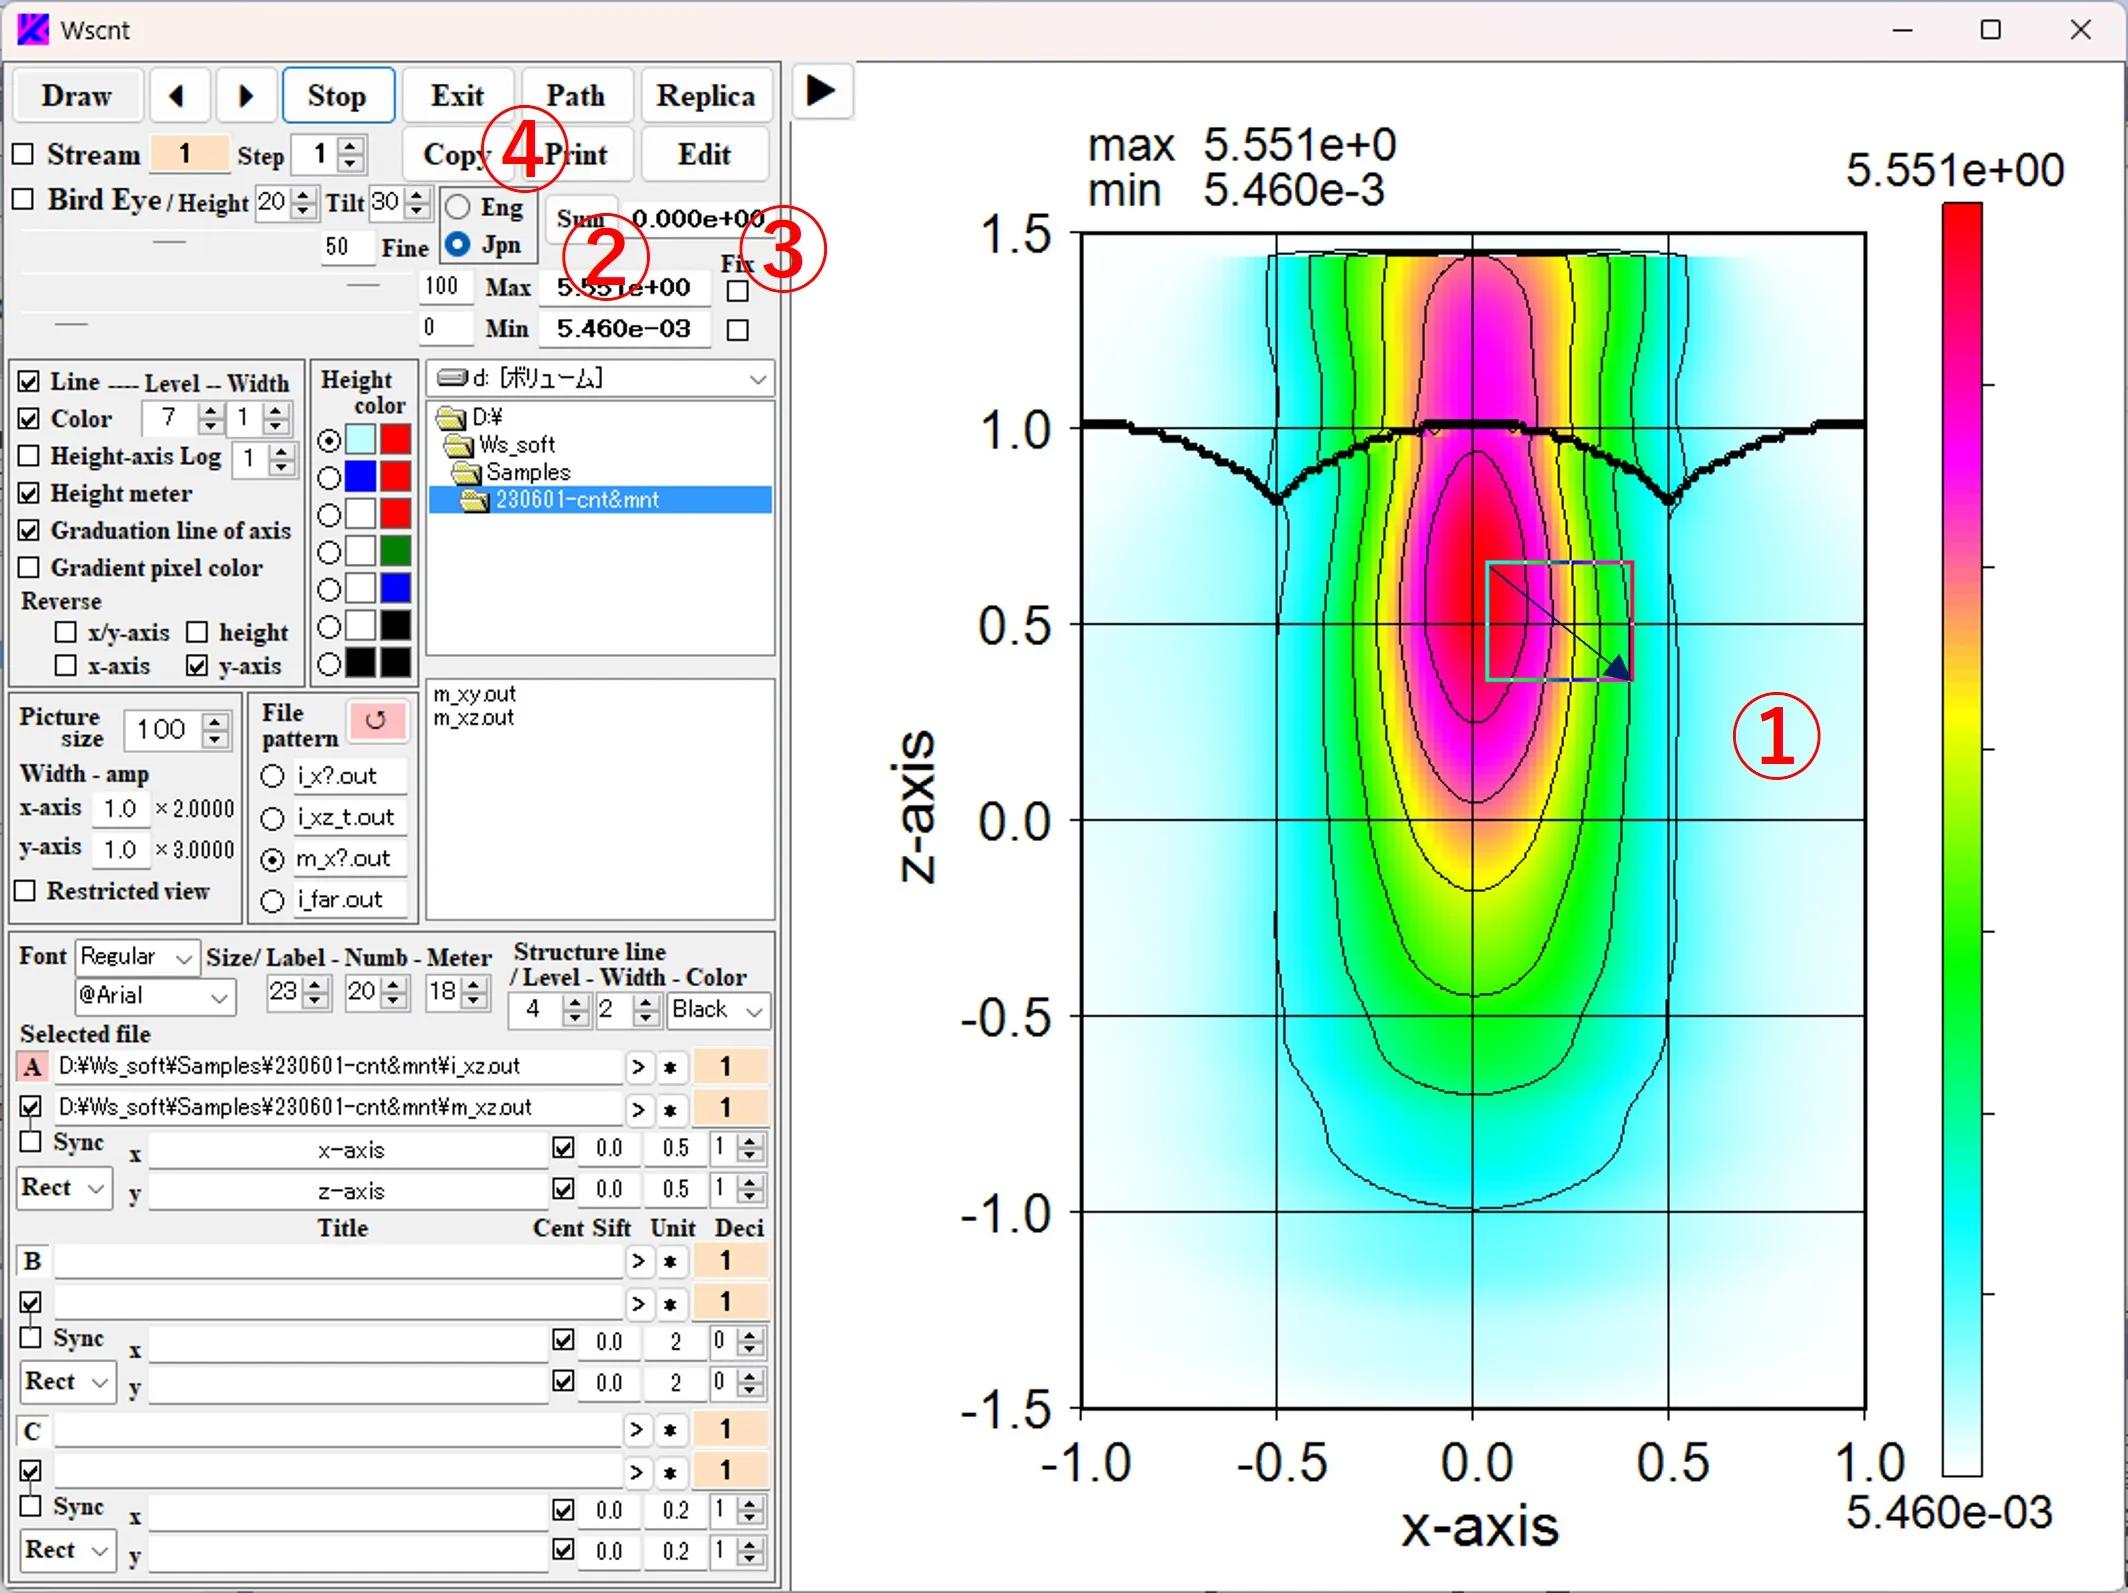
Specify the area ① on the image with Drop down & up. When the Sum button ② is clicked, the sum value of the intensity in the specified area is displayed in the box ③ (does not work in the Bird's eye display). When the Copy button ④ is clicked, the image ⑤ in the specified area is cut out and copied to the clipboard. If the Sum button ② is clicked without specifying the area, the total value of the intensity for the entire area is displayed. Similarly, when the Copy button ④ is clicked, the entire area is copied to the clipboard.
13. Displaying serial images ▲top
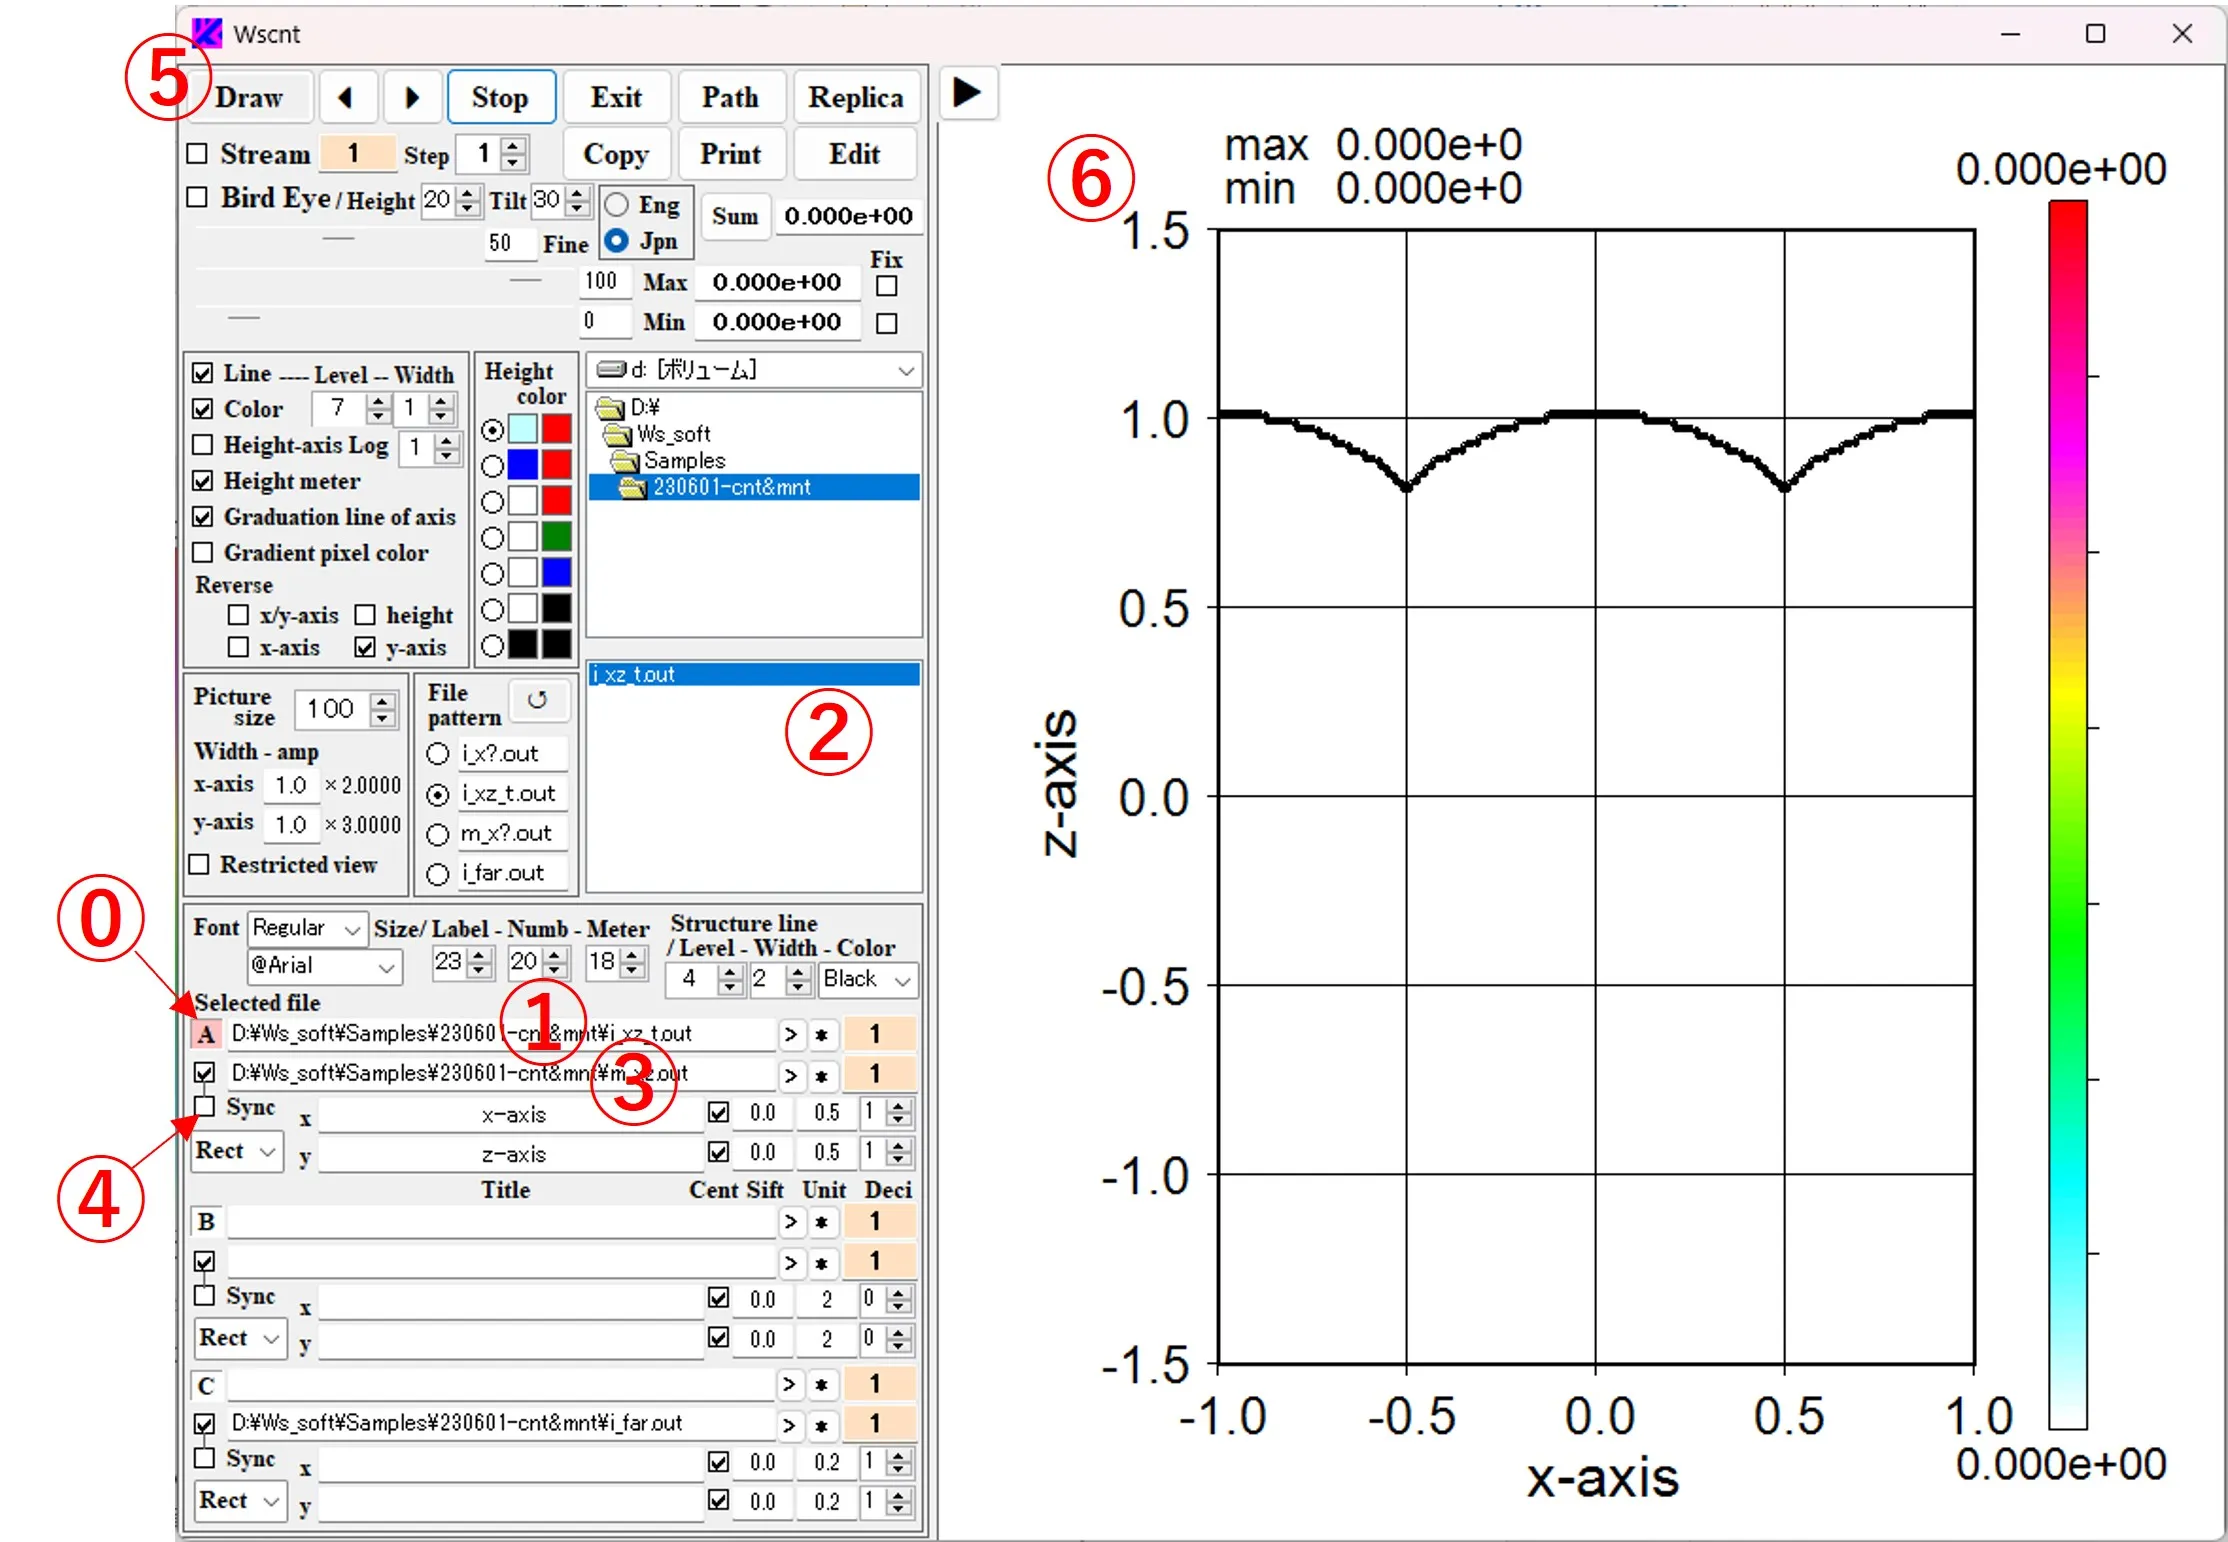
(1) Click the button A ⓪ and select the file ② (i_xz_t.out) in box ①, and switch the file pattern and select structure data (m_xz.out) in box ③. i_xz_t.out is serial data in time series, but since m_xz.out is single data, the sync button ④ is not checked. When the Draw button ⑤ is clicked, the first contour image ⑥ is displayed with a structural border (the first image does not appear in the display because its intensity is zero).
(2) If you click the button ⑦, check the box and click the Draw button ⑤, the contour image ⑧ is continuously rewritten until the final data, and the order of the displayed images is displayed in boxes ⑨ and ⑩. If you right-click the Stream button ⑦, "Stream" will change to "Cycle" and continuous drawing will be repeated. If you click the Stop button ⑪, the rewriting will be interrupted in the middle. Note that when the drawing data is a combination of i_xy.out and m_xy.out, both are continuous data that is synchronously stacked and that the sync button ④ should be checked at the time of drawing.

(3) By clicking the buttons ① of ◀ and ▶ , the order ③ of the serial images ② is moved back and forth. The step width of the feed can be set with the button ④.

(4) Check the Height box ⑤ to reverse the height relationship of the contour color. When the contour color selection button ⑥ is changed, the color pattern changes, and the image of ⑦ is displayed (the color of the structural border ⑧ is also changed).

(5) When the contour image ② is displayed in any order ① of the data in the serial data, the maximum value and values (called the Local values) are displayed in the boxes ③, and the same value is also described in the upper left ④ of the drawing.

(6) When the Fix box ⑤ is checked, the maximum and minimum values are fixed to ⑥. When the order ⑦ of serial data is changed in this state, a contour image ⑧ represented by the color level of the fixed value ⑥ (called as the Global value) is displayed. The Local value (maximum and minimum values for the data of the displayed image) is displayed in the upper left ⑨ of the figure, and the Global value (maximum and minimum values of the color level) is expressed in the upper right ⑩ of the figure. In the Height meter on the right side of the figure, the Global value is indicated by the top and bottom edges, and the Local value is indicated by a black horizontal line.

(7) Movie manipulation and unification of intensity scale: Check the Stream box ①, set the value of box ③ to 1, and click the Draw button ② to display the serial data images ④ in order, and the box ⑤ displays the maximum and minimum values through all the data. The upper left ⑥ of the figure is the maximum value and the minimum value (that is, the Local value) of the final image data. After the serial image drawing is completed, check the Fix box ⑦ to return the box ③ to the starting point, check the Stream box ① and click the Draw button ②. A serial images are displayed with the intensity scale unified at a fixed value (maximum value and minimum value in serial data, i.e., Global value).


(8) Maximum and minimum values of bird's eye images: In the case of a bird's eye image, the maximum and minimum values of the currently displayed image data are shown in the upper left ① of the figure, and the fixed value ② is displayed above and below the height meter ③ in the figure.

(9) Log setting of height scale: Check the box ① to change the height scale of the contour line from the linear scale to the log scale. The box ② is the exponent n of the Log scale (z' = n* log10 (9 * (z-zmin) / (zmax-zmin) + 1)), and the larger it is, the more emphasis is on the low frequency of intensity.


(10) Synchronous display: Click the button B ①, click the box ② and select the file (i_xy.out). Check the box ③ and click the box ④ to select the file (m_xy.out). Since both of these files are synchronized serial image data, the Sync box ⑤ can be checked. Click the Draw button ⑥ to display the first contour image ⑦. When the button ▶ ⑧ is clicked and the order of the data (i_xy.out) on the contour image is advanced, the order of the data (m_xy.out) of the structural boundary also proceeds as shown in ⑨, and the structural boundary is rewritten synchronously with the contour image.


14. Displaying circular coordinates, stretching the operation panel ▲top
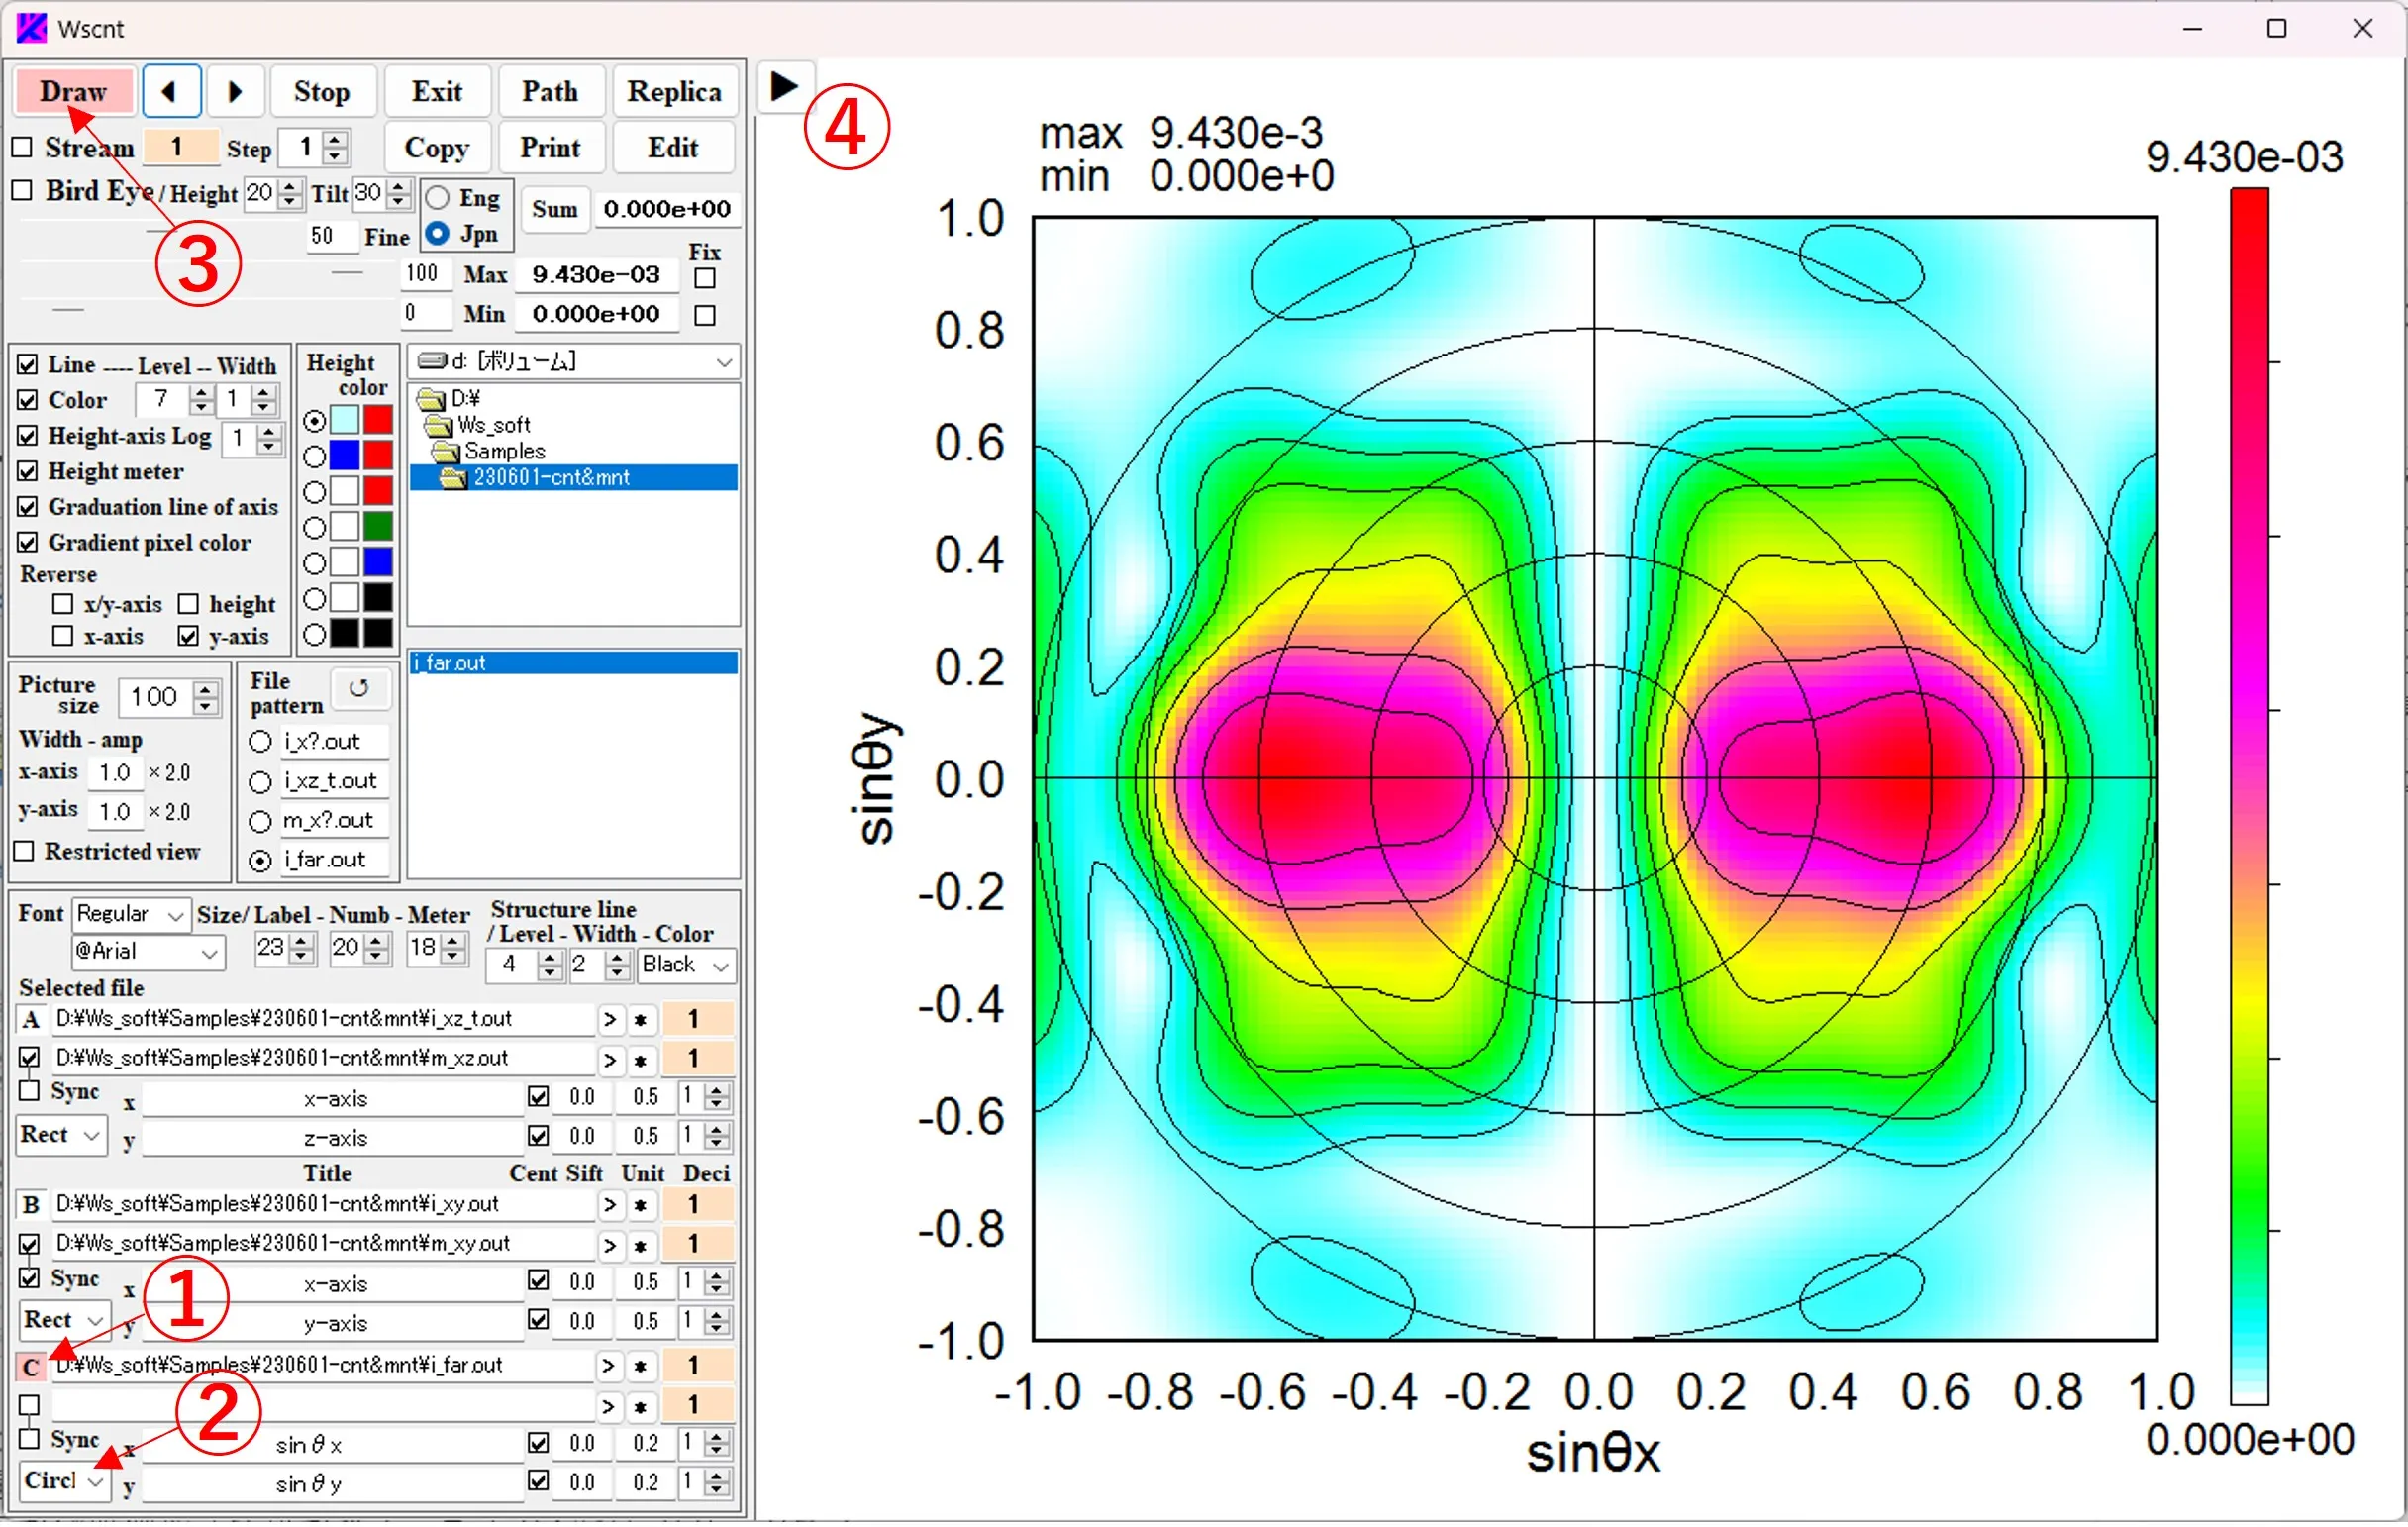
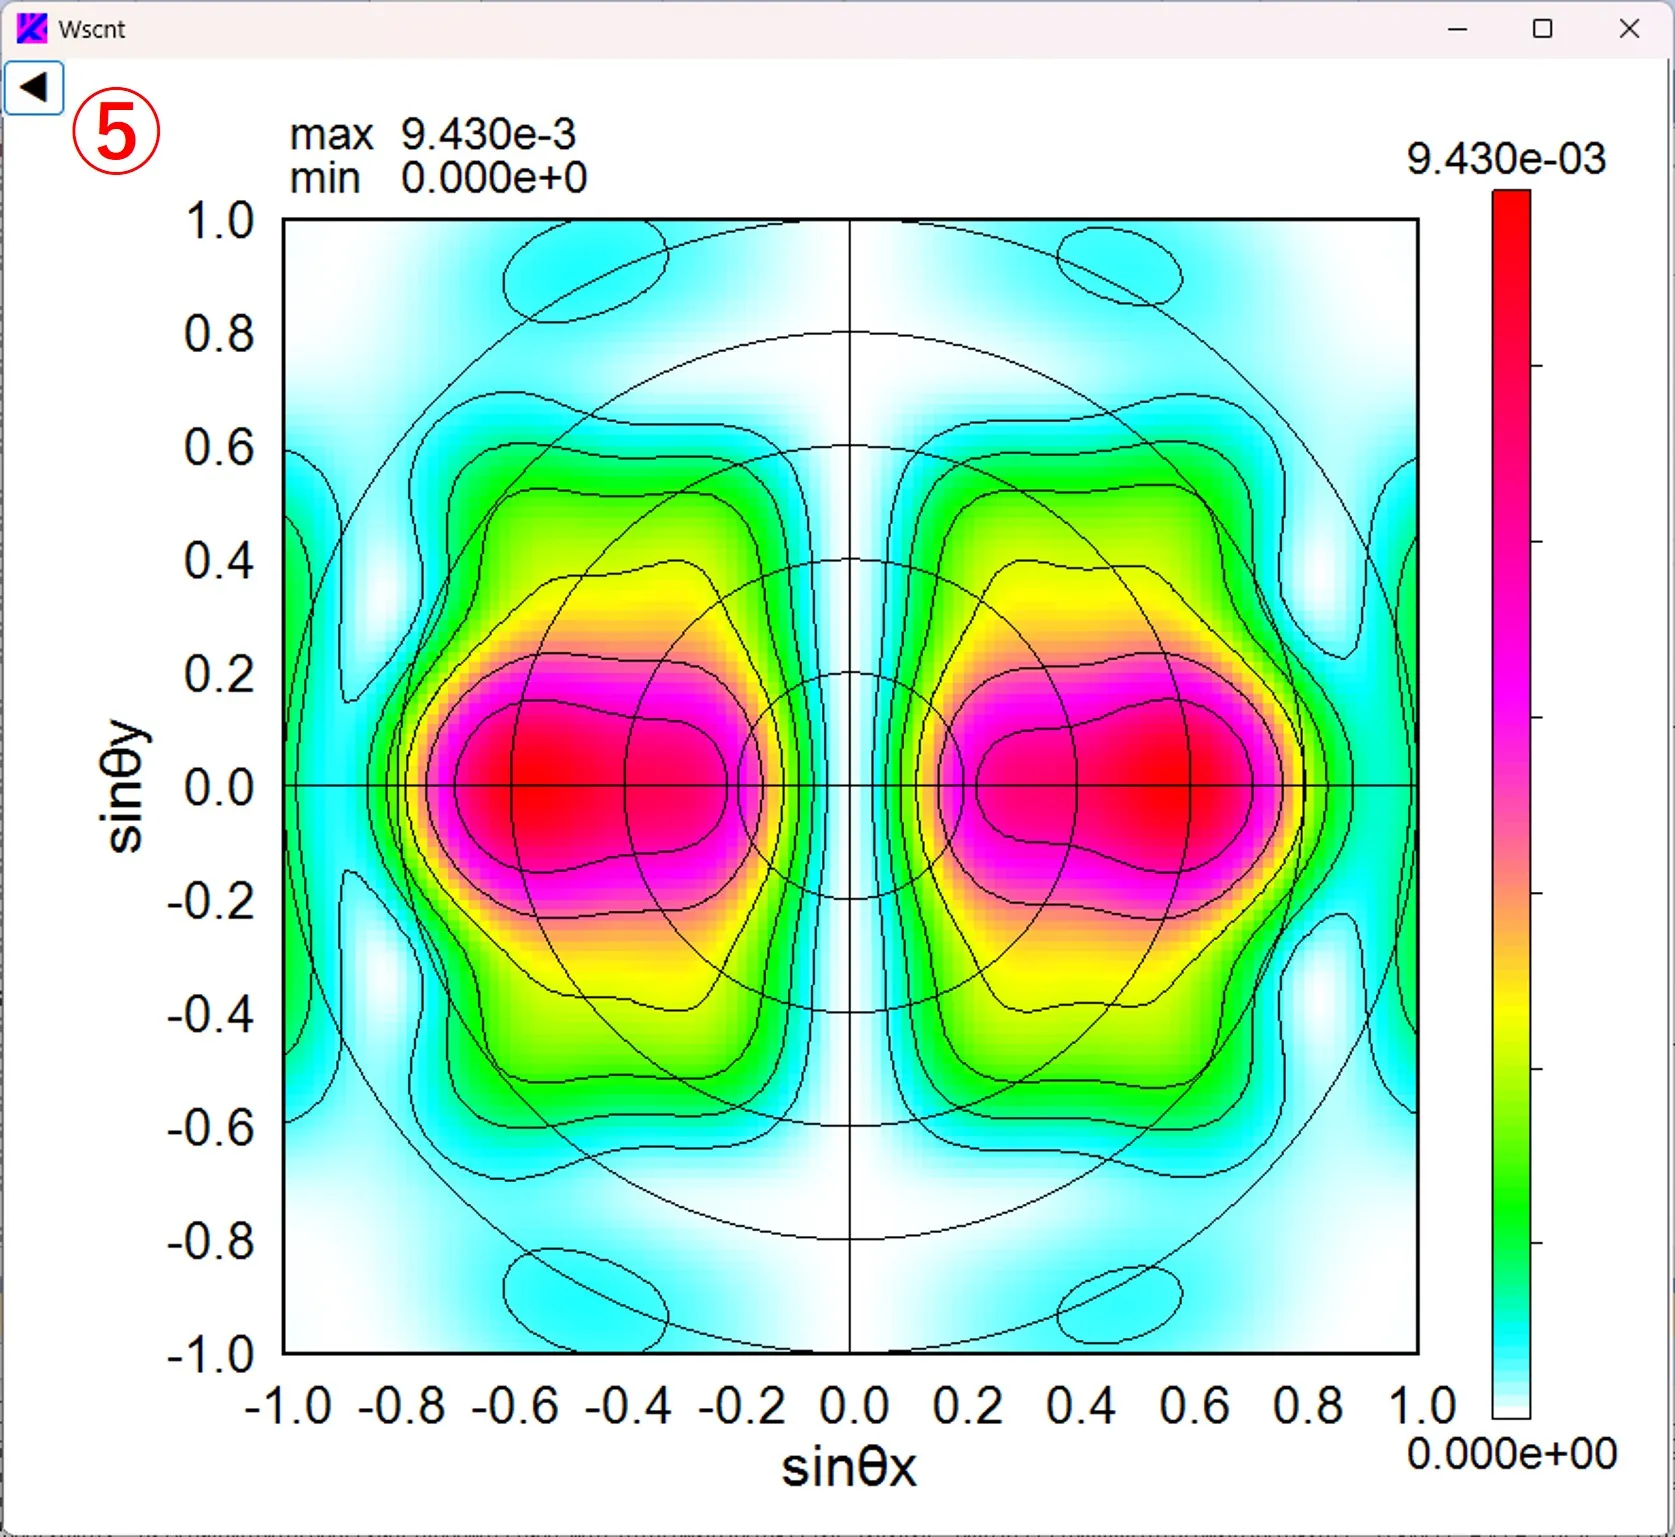
(1) Click the C button ① and select a file. When circular coordinates (Circl) are selected for the axis type ② and the Draw button ③ is clicked, the far-field intensity distribution is drawn in polar coordinate format. Click the button ▶ ④ to remove the operation panel on the left side.
(2) Click the button ◀ ⑤ to display the operation panel.

15. Useful shortcuts ▲top
① Double-click to reset.② Right-click to move the directory list to the directory of the display file, and double-click to delete the displayed contents.
③ Right-click to switch the vertical size to long and short.
④ If the contents of the left file path box exceed the box length, it is slided left and right.
⑤ The history of past operations is refered. When you click the button, the file selection window ⑥ appears, and if you select the desired wscnt.pth from here, the main window performed in the past is reproduced. The file of wscnt.pth is created (overwritten) in the folder containing the file of Wscnt.exe and the folder listed in the file path box (the box on the right side of buttons A, B, and C) each time the Draw button is pressed.

